

使用诸如梯度增强之类的决策树方法的集成的好处是,它们可以从训练有素的预测模型中自动提供特征重要性的估计。
在本文中,您将发现如何使用Python中的XGBoost库来估计特征对于预测性建模问题的重要性,阅读这篇文章后,您将知道:
如何使用梯度提升算法计算特征重要性。
如何绘制由XGBoost模型计算的Python中的特征重要性。
如何使用XGBoost计算的特征重要性来执行特征选择。
梯度提升中的特征重要性
使用梯度增强的好处是,在构建增强后的树之后,检索每个属性的重要性得分相对简单。通常,重要性提供了一个分数,该分数指示每个特征在模型中构建增强决策树时的有用性或价值。用于决策树的关键决策使用的属性越多,其相对重要性就越高。
此重要性是针对数据集中的每个属性明确计算得出的,从而可以对属性进行排名并进行相互比较。单个决策树的重要性是通过每个属性拆分点提高性能指标的数量来计算的,并由节点负责的观察次数来加权。性能度量可以是用于选择拆分点的纯度(基尼系数),也可以是其他更特定的误差函数。然后,将特征重要性在模型中所有决策树之间平均。有关如何在增强型决策树中计算特征重要性的更多技术信息,请参见《统计学习的要素:数据挖掘,推理和预测》(第367页)第10.13.1节“预测变量的相对重要性”。另外,请参见Matthew Drury对StackOverflow问题“ Boosting的相对变量重要性”的回答,在此他提供了非常详细和实用的答案。
手动绘制特征重要性
训练有素的XGBoost模型会自动计算出您的预测建模问题中的特征重要性。这些重要性分数可在训练模型的feature_importances_成员变量中获得。例如,可以按如下所示直接打印它们:
print(model.feature_importances_)
我们可以将这些得分直接绘制在条形图上,以直观表示数据集中每个特征的相对重要性。例如:
#?plot
pyplot.bar(range(len(model.feature_importances_)),?model.feature_importances_)
pyplot.show()
我们可以通过在皮马印第安人发病的糖尿病数据集上训练XGBoost模型并根据计算出的特征重要性创建条形图来证明这一点。
下载数据集并将其放置在当前工作目录中。
数据集文件:
https://raw.githubusercontent.com/jbrownlee/Datasets/master/pima-indians-diabetes.csv
数据集详细信息:
https://raw.githubusercontent.com/jbrownlee/Datasets/master/pima-indians-diabetes.names
#?plot?feature?importance?manually
from?numpy?import?loadtxt
from?xgboost?import?XGBClassifier
from?matplotlib?import?pyplot
#?load?data
dataset?=?loadtxt('pima-indians-diabetes.csv',?delimiter=",")
#?split?data?into?X?and?y
X?=?dataset[:,0:8]
y?=?dataset[:,8]
#?fit?model?no?training?data
model?=?XGBClassifier()
model.fit(X,?y)
#?feature?importance
print(model.feature_importances_)
#?plot
pyplot.bar(range(len(model.feature_importances_)),?model.feature_importances_)
pyplot.show()
注意:由于算法或评估程序的随机性,或者数值精度的差异,您的结果可能会有所不同。考虑运行该示例几次并比较平均结果。
首先运行此示例将输出重要性分数。
[?0.089701????0.17109634??0.08139535??0.04651163??0.10465116??0.2026578?0.1627907???0.14119601]
我们还获得了相对重要性的条形图。
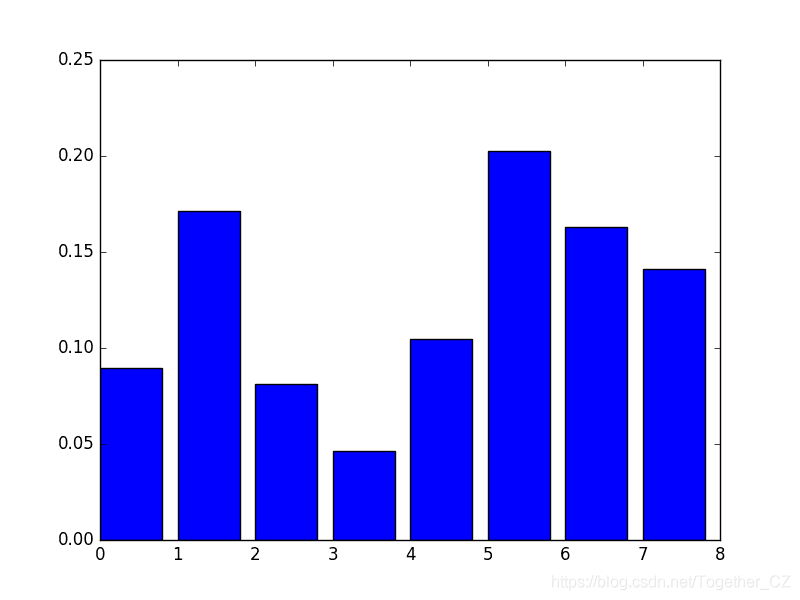
该图的缺点是要素按其输入索引而不是其重要性排序。我们可以在绘制之前对特征进行排序。
值得庆幸的是,有一个内置的绘图函数可以帮助我们。
使用内置XGBoost特征重要性图XGBoost库提供了一个内置函数,可以按重要性顺序绘制要素。该函数称为plot_importance(),可以按以下方式使用:
#?plot?feature?importance
plot_importance(model)
pyplot.show()
例如,以下是完整的代码清单,其中使用内置的plot_importance()函数绘制了Pima Indians数据集的特征重要性。
#?plot?feature?importance?using?built-in?function
from?numpy?import?loadtxt
from?xgboost?import?XGBClassifier
from?xgboost?import?plot_importance
from?matplotlib?import?pyplot
#?load?data
dataset?=?loadtxt('pima-indians-diabetes.csv',?delimiter=",")
#?split?data?into?X?and?y
X?=?dataset[:,0:8]
y?=?dataset[:,8]
#?fit?model?no?training?data
model?=?XGBClassifier()
model.fit(X,?y)
#?plot?feature?importance
plot_importance(model)
pyplot.show()
注意:由于算法或评估程序的随机性,或者数值精度的差异,您的结果可能会有所不同。考虑运行该示例几次并比较平均结果。
运行该示例将为我们提供更有用的条形图。
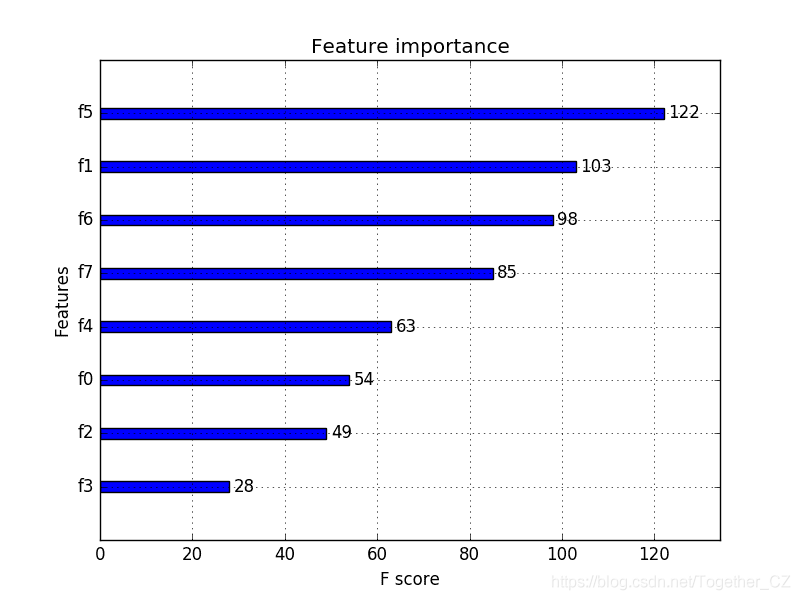
您可以看到,要素是根据它们在F0至F7的输入数组(X)中的索引自动命名的。手动将这些索引映射到问题描述中的名称,可以看到该图显示F5(体重指数)具有最高的重要性,而F3(皮肤褶皱厚度)具有最低的重要性。
XGBoost特征重要性评分的特征选择
特征重要性评分可用于scikit-learn中的特征选择。这是通过使用SelectFromModel类完成的,该类采用一个模型,并且可以将数据集转换为具有选定要素的子集。此类可以采用预训练的模型,例如在整个训练数据集上进行训练的模型。然后,它可以使用阈值来确定要选择的特征。当您在SelectFromModel实例上调用transform()方法以一致地选择训练数据集和测试数据集上的相同要素时,将使用此阈值。
在下面的示例中,我们首先训练,然后分别在整个训练数据集和测试数据集上评估XGBoost模型。使用从训练数据集计算出的特征重要性,然后将模型包装在SelectFromModel实例中。我们使用它来选择训练数据集上的特征,从选定的特征子集中训练模型,然后在测试集上评估模型,并遵循相同的特征选择方案。
例如:
#?select?features?using?threshold
selection?=?SelectFromModel(model,?threshold=thresh,?prefit=True)
select_X_train?=?selection.transform(X_train)
#?train?model
selection_model?=?XGBClassifier()
selection_model.fit(select_X_train,?y_train)
#?eval?model
select_X_test?=?selection.transform(X_test)
y_pred?=?selection_model.predict(select_X_test)
出于兴趣,我们可以测试多个阈值,以根据特征重要性选择特征。具体来说,每个输入变量的特征重要性,从本质上讲,使我们能够按重要性测试每个特征子集,从所有特征开始,到具有最重要特征的子集结束。
下面提供了完整的代码清单:
#?use?feature?importance?for?feature?selection
from?numpy?import?loadtxt
from?numpy?import?sort
from?xgboost?import?XGBClassifier
from?sklearn.model_selection?import?train_test_split
from?sklearn.metrics?import?accuracy_score
from?sklearn.feature_selection?import?SelectFromModel
#?load?data
dataset?=?loadtxt('pima-indians-diabetes.csv',?delimiter=",")
#?split?data?into?X?and?y
X?=?dataset[:,0:8]
Y?=?dataset[:,8]
#?split?data?into?train?and?test?sets
X_train,?X_test,?y_train,?y_test?=?train_test_split(X,?Y,?test_size=0.33,?random_state=7)
#?fit?model?on?all?training?data
model?=?XGBClassifier()
model.fit(X_train,?y_train)
#?make?predictions?for?test?data?and?evaluate
y_pred?=?model.predict(X_test)
predictions?=?[round(value)?for?value?in?y_pred]
accuracy?=?accuracy_score(y_test,?predictions)
print("Accuracy:?%.2f%%"?%?(accuracy?*?100.0))
#?Fit?model?using?each?importance?as?a?threshold
thresholds?=?sort(model.feature_importances_)
for?thresh?in?thresholds:
?#?select?features?using?threshold
?selection?=?SelectFromModel(model,?threshold=thresh,?prefit=True)
?select_X_train?=?selection.transform(X_train)
?#?train?model
?selection_model?=?XGBClassifier()
?selection_model.fit(select_X_train,?y_train)
?#?eval?model
?select_X_test?=?selection.transform(X_test)
?y_pred?=?selection_model.predict(select_X_test)
?predictions?=?[round(value)?for?value?in?y_pred]
?accuracy?=?accuracy_score(y_test,?predictions)
?print("Thresh=%.3f,?n=%d,?Accuracy:?%.2f%%"?%?(thresh,?select_X_train.shape[1],?accuracy*100.0))
请注意,如果您使用的是XGBoost 1.0.2(可能还有其他版本),则XGBClassifier类中存在一个错误,该错误会导致错误:
KeyError:?'weight'
这可以通过使用自定义XGBClassifier类来解决,该类为coef_属性返回None。下面列出了完整的示例。
#?use?feature?importance?for?feature?selection,?with?fix?for?xgboost?1.0.2
from?numpy?import?loadtxt
from?numpy?import?sort
from?xgboost?import?XGBClassifier
from?sklearn.model_selection?import?train_test_split
from?sklearn.metrics?import?accuracy_score
from?sklearn.feature_selection?import?SelectFromModel
?
#?define?custom?class?to?fix?bug?in?xgboost?1.0.2
class?MyXGBClassifier(XGBClassifier):
?@property
?def?coef_(self):
??return?None
?
#?load?data
dataset?=?loadtxt('pima-indians-diabetes.csv',?delimiter=",")
#?split?data?into?X?and?y
X?=?dataset[:,0:8]
Y?=?dataset[:,8]
#?split?data?into?train?and?test?sets
X_train,?X_test,?y_train,?y_test?=?train_test_split(X,?Y,?test_size=0.33,?random_state=7)
#?fit?model?on?all?training?data
model?=?MyXGBClassifier()
model.fit(X_train,?y_train)
#?make?predictions?for?test?data?and?evaluate
predictions?=?model.predict(X_test)
accuracy?=?accuracy_score(y_test,?predictions)
print("Accuracy:?%.2f%%"?%?(accuracy?*?100.0))
#?Fit?model?using?each?importance?as?a?threshold
thresholds?=?sort(model.feature_importances_)
for?thresh?in?thresholds:
?#?select?features?using?threshold
?selection?=?SelectFromModel(model,?threshold=thresh,?prefit=True)
?select_X_train?=?selection.transform(X_train)
?#?train?model
?selection_model?=?XGBClassifier()
?selection_model.fit(select_X_train,?y_train)
?#?eval?model
?select_X_test?=?selection.transform(X_test)
?predictions?=?selection_model.predict(select_X_test)
?accuracy?=?accuracy_score(y_test,?predictions)
?print("Thresh=%.3f,?n=%d,?Accuracy:?%.2f%%"?%?(thresh,?select_X_train.shape[1],?accuracy*100.0))
注意:由于算法或评估程序的随机性,或者数值精度的差异,您的结果可能会有所不同。考虑运行该示例几次并比较平均结果。
运行此示例将打印以下输出。
Accuracy:?77.95%
Thresh=0.071,?n=8,?Accuracy:?77.95%
Thresh=0.073,?n=7,?Accuracy:?76.38%
Thresh=0.084,?n=6,?Accuracy:?77.56%
Thresh=0.090,?n=5,?Accuracy:?76.38%
Thresh=0.128,?n=4,?Accuracy:?76.38%
Thresh=0.160,?n=3,?Accuracy:?74.80%
Thresh=0.186,?n=2,?Accuracy:?71.65%
Thresh=0.208,?n=1,?Accuracy:?63.78%
我们可以看到,模型的性能通常随所选特征的数量而降低。
在此问题上,需要权衡测试集精度的特征,我们可以决定采用较不复杂的模型(较少的属性,例如n = 4),并接受估计精度的适度降低,从77.95%降至76.38%。
这可能是对这么小的数据集的洗礼,但是对于更大的数据集并使用交叉验证作为模型评估方案可能是更有用的策略。
作者:沂水寒城,CSDN博客专家,个人研究方向:机器学习、深度学习、NLP、CV
Blog:?http://yishuihancheng.blog.csdn.net
赞 赏 作 者

更多阅读
特别推荐


点击下方阅读原文加入社区会员

【排序算法】之lowb三人组冒泡、插入、选择 什么是lowb三人组 冒泡排序bubble so...
vbs:把一段文字中指定字符颜色变成红色的正则 functionc(Tstr,Word) Dimre Setre...
歌词编辑器 歌词编辑器 第一步:选择要播放的歌曲并播放 第二步:填写全部的歌词...
ADO对象: Connection Command Recordset Record Stream ASP支持的对象很多,可...
计算属性computed: 支持缓存,只有依赖数据发生改变,才会重新进行计算 不支持...
前言 相信大家都知道在IDE中代码的智能提示几乎都是标配,虽然一些文本编辑器也...
一石激起千层浪,继中国区浩浩荡荡的大裁员告一段落之后,甲骨文并未因此收起手...
微信文件传输助手是微信电脑版与手机微信之间相互传输图片等文件的好工具,但很...
一、正则表达式概述 二、正则表达式在VBScript中的应用 三、正则表达式在VavaScr...
本文将研究 ES6 的 for ... of 循环。 旧方法 在过去,有两种方法可以遍历 javas...