
学无止境,任何形式的学习,最终必须要有输出才有可能变成自己的知识体系和知识积累。这篇文章也是自己对ELK学习过程中的一次输出,我按照我一贯学习新技术的常用思维(3W1H)去总结归纳。
ELK 是ElasticSearch开源生态中提供的一套完整日志收集、分析以及展示的解决方案,是三个产品的首字母缩写,分别是ElasticSearch、Logstash 和 Kibana。除此之外,FileBeat也是目前使用较多的日志收集软件,相对于Logstash更加轻量级占用资源更少。本文学习还是以Logstash为例。
ElasticSearch ,它是一个近实时(NRT)的分布式搜索和分析引擎,它可以用于全文搜索,结构化搜索以及分析。它是一个建立在全文搜索引擎 Apache Lucene 基础上的搜索引擎,使用 Java 语言编写。
Logstash ,它是一个具有近实时(NRT)传输能力的数据收集、过滤、分析引擎,用来进行数据收集、解析、过滤,并最终将数据发送给ES。
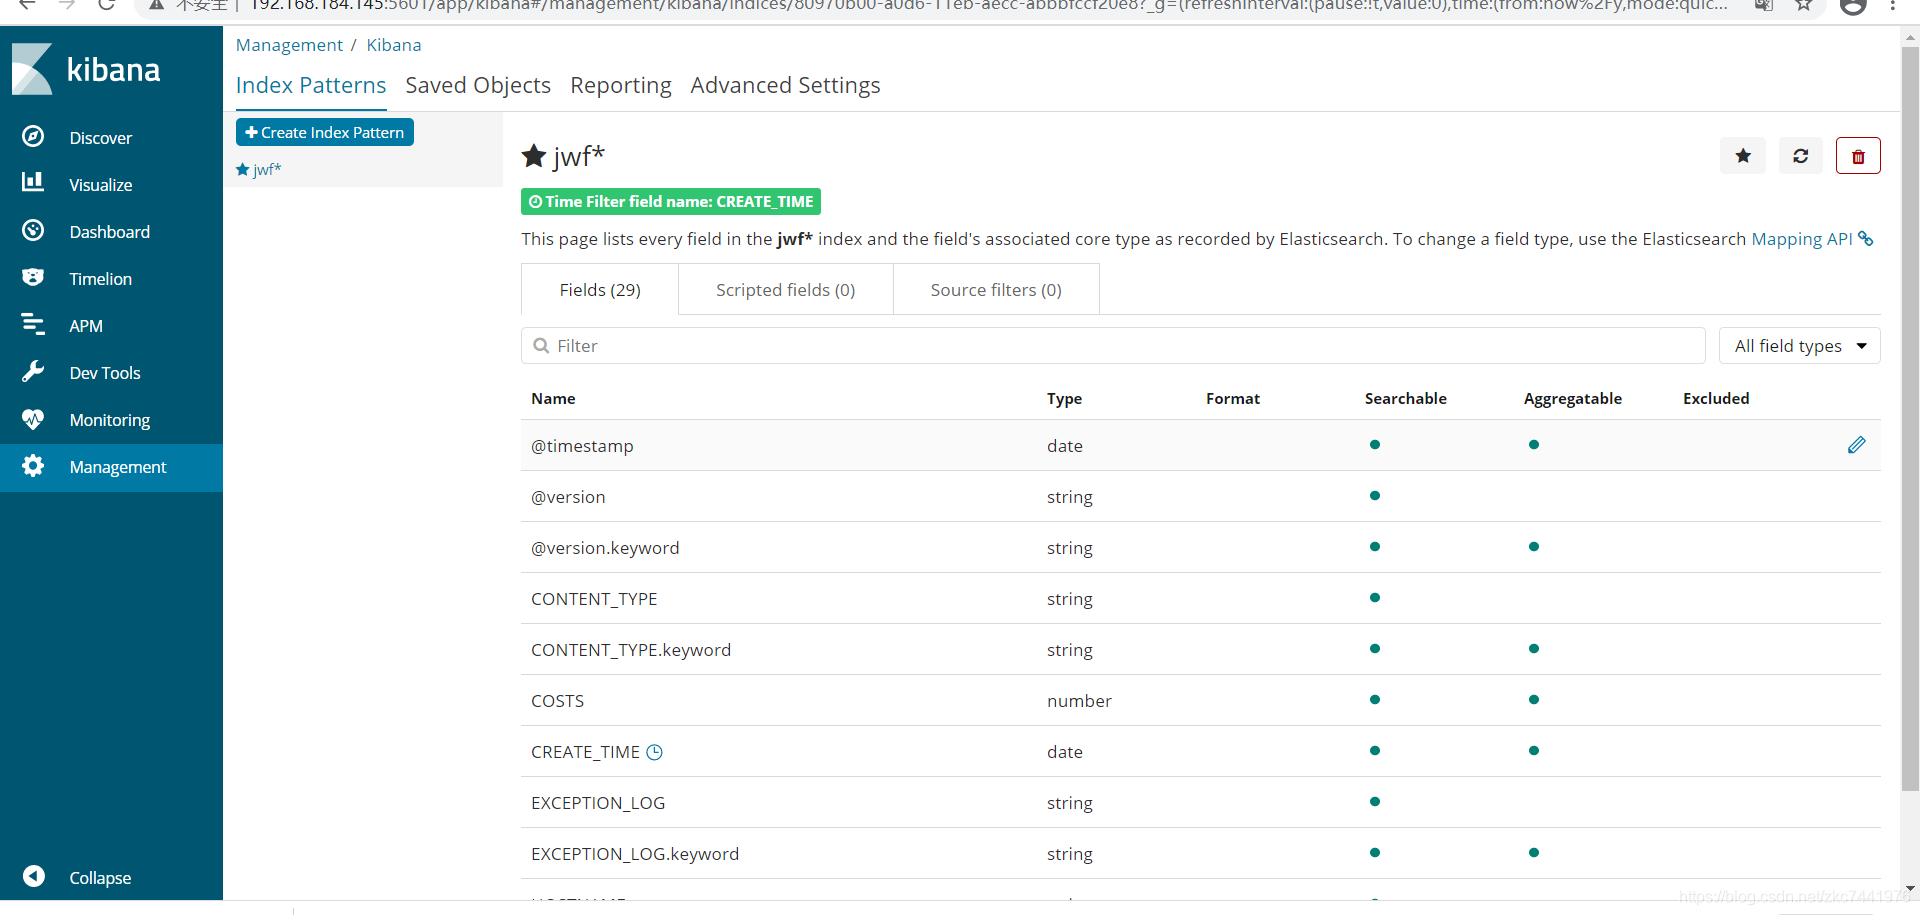
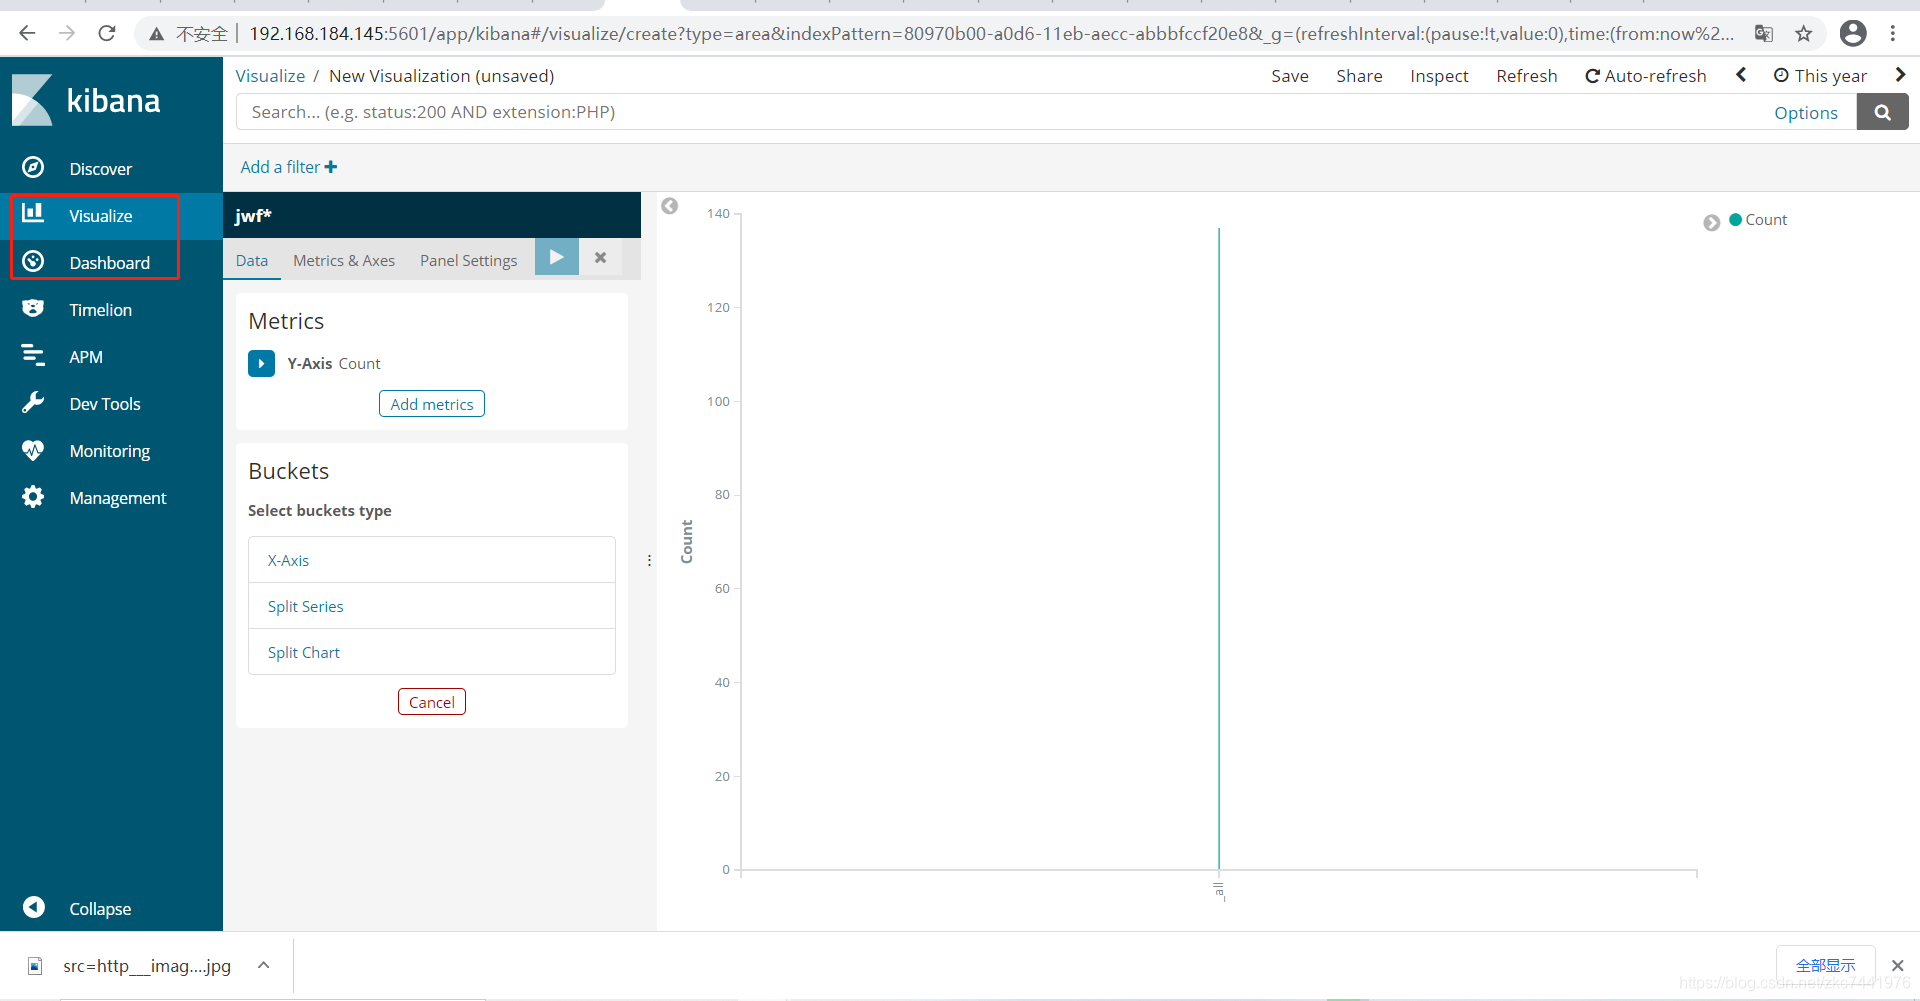
Kibana ,它是一个为 ElasticSearch 提供分析和展示的可视化 Web 平台。它可以在 ElasticSearch 的索引中查找,交互数据,并生成各种维度表格、图形以及仪表盘。

随着我们系统架构的不断升级,由单体转为分布式、微服务、网格系统等,用户访问产生的日志量也在不断增加,我们急需一个可以快速、准确查询和分析日志的平台。
一个完整的日志分析平台,需要包含以下几个主要特点:
而ELK的出现则为我们提供了一个完整的解决方案,并且都是开源软件,之间互相配合使用,完美衔接,高效的满足了很多场合的应用。是目前主流的一种日志系统。传统意义上,ELK也是作为替代Splunk(日志分析领域的领导者)的一个开源解决方案。
ELK的核心使用场景,肯定是用于大型软硬件系统的日志采集、分析、展示。近年来随着互联网用户的急剧增加,各种场景也被进一步挖掘出来,刚好最近几年也是大数据比较火热的时候,大家都在使用各种大数据的产品,我们发现 Elasticsearch 就有处理海量数据的能力,几十百 TB 处理起来也很正常,并且比 Hadoop 更方便,速度更快。因此ELK也被用于其他场景,比如 SIEM 领域,有很多公司用来进行安全方面的数据分析,做企业防入侵检测、异常流量分析、用户行为分析等。
我们以一个实战项目为基础,从零开始搭建。
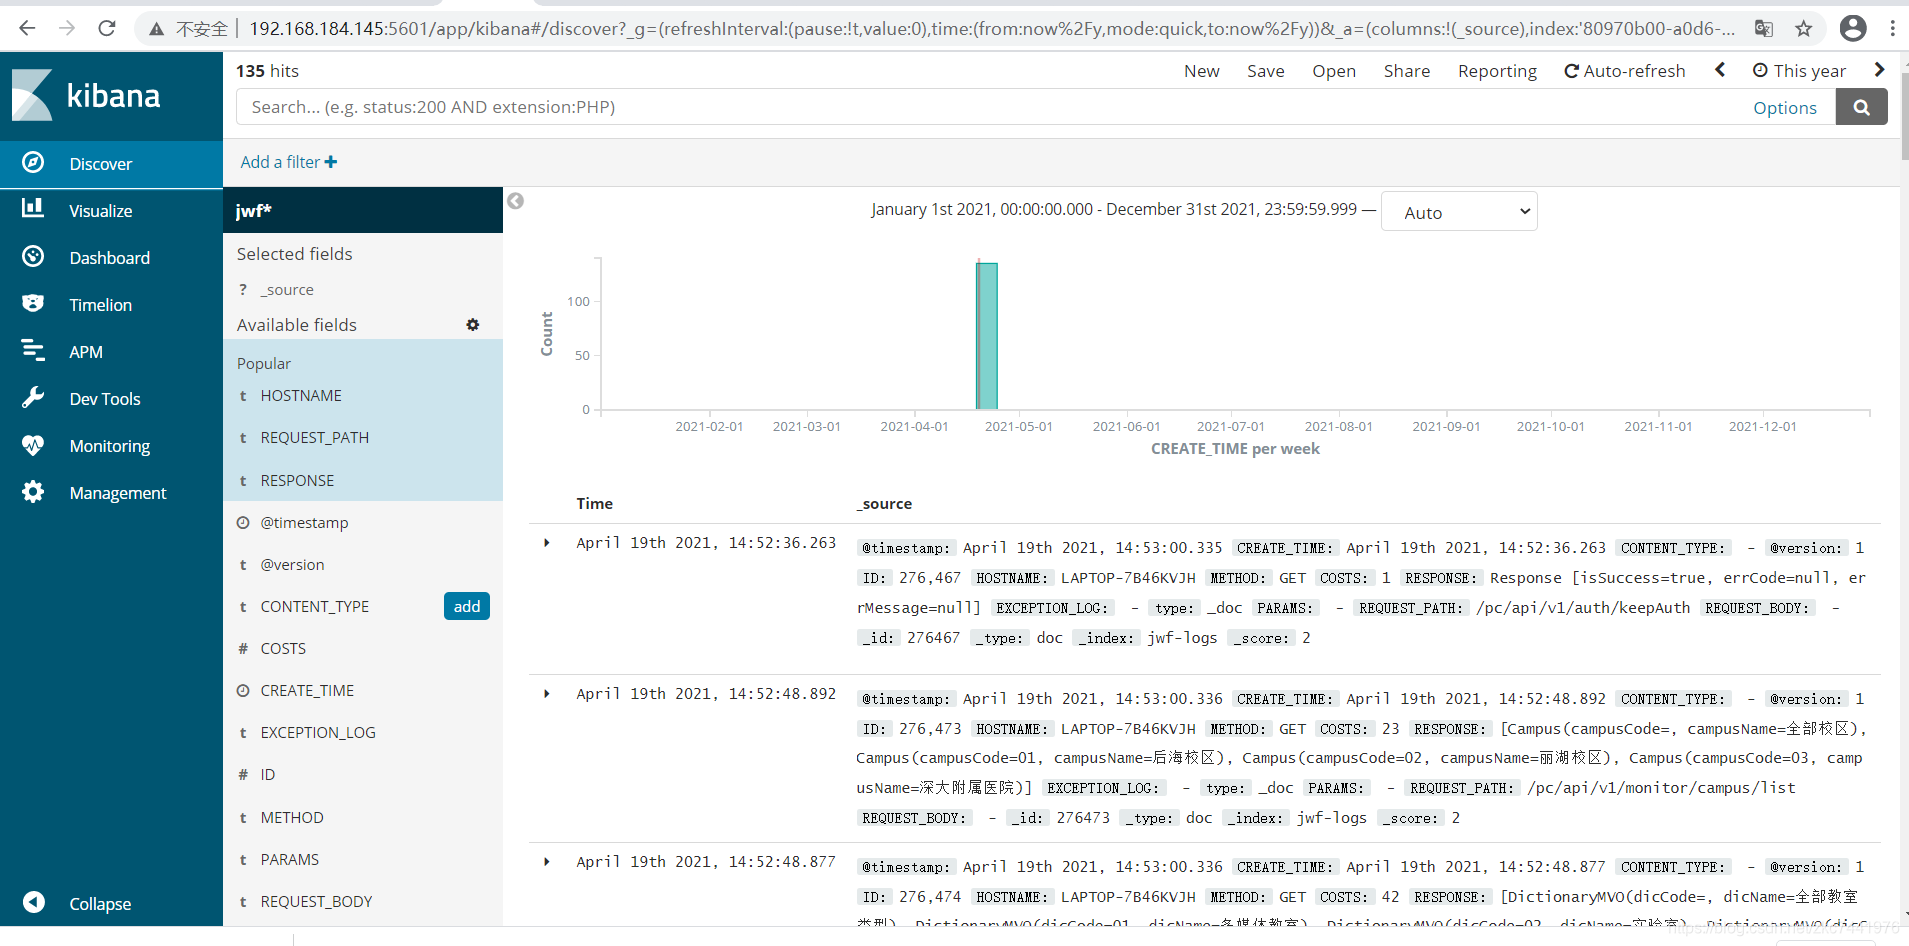
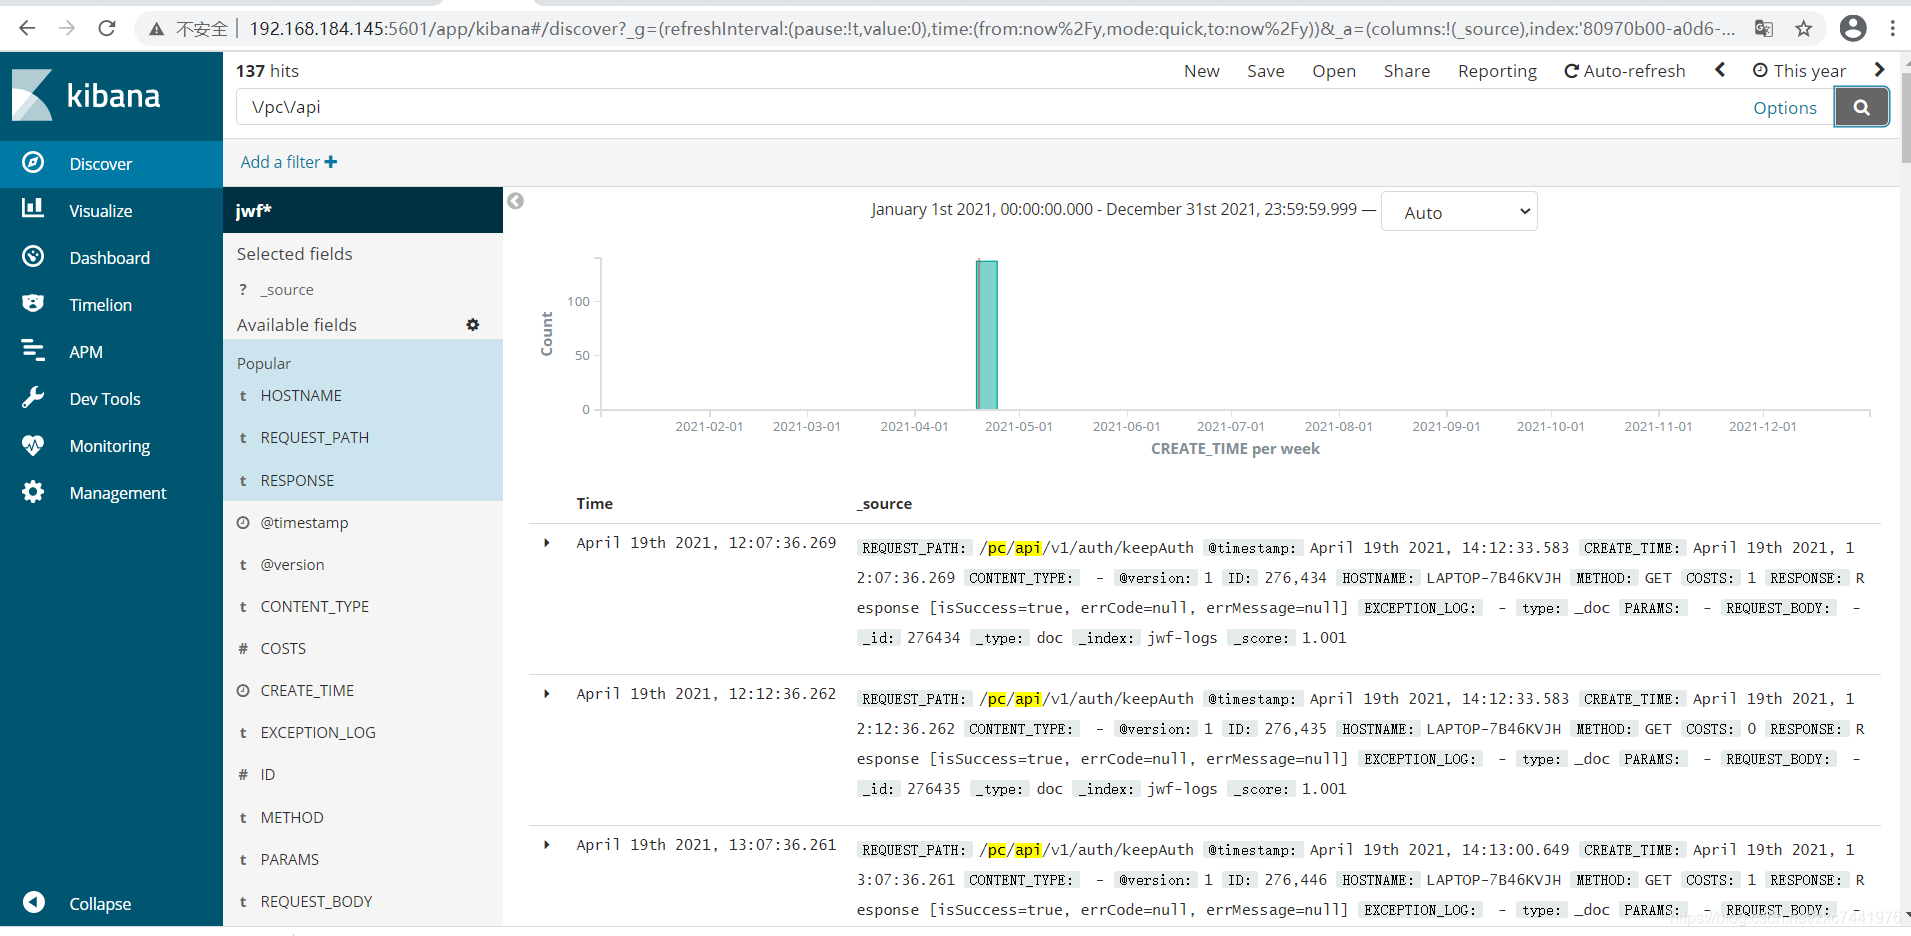
对业务系统日志(系统日志+用户访问日志)进行实时搜索、分析和展示。
去官网下载ES,本文中以elasticsearch-6.4.3.tar.gz为例
# ======================== Elasticsearch Configuration =========================
#
# NOTE: Elasticsearch comes with reasonable defaults for most settings.
#       Before you set out to tweak and tune the configuration, make sure you
#       understand what are you trying to accomplish and the consequences.
#
# The primary way of configuring a node is via this file. This template lists
# the most important settings you may want to configure for a production cluster.
#
# Please consult the documentation for further information on configuration options:
# https://www.elastic.co/guide/en/elasticsearch/reference/index.html
#
# ---------------------------------- Cluster -----------------------------------
#
# Use a descriptive name for your cluster:
#
cluster.name: zkc-elasticsearch
#
# ------------------------------------ Node ------------------------------------
#
# Use a descriptive name for the node:
#
node.name: node-0
#
# Add custom attributes to the node:
#
#node.attr.rack: r1
#
# ----------------------------------- Paths ------------------------------------
#
# Path to directory where to store the data (separate multiple locations by comma):
#
path.data: /usr/local/elasticsearch-6.4.3/data
#
# Path to log files:
#
path.logs: /usr/local/elasticsearch-6.4.3/logs
#
# ----------------------------------- Memory -----------------------------------
#
# Lock the memory on startup:
#
#bootstrap.memory_lock: true
#
# Make sure that the heap size is set to about half the memory available
# on the system and that the owner of the process is allowed to use this
# limit.
#
# Elasticsearch performs poorly when the system is swapping the memory.
#
# ---------------------------------- Network -----------------------------------
#
# Set the bind address to a specific IP (IPv4 or IPv6):
#
network.host: 0.0.0.0
#
# Set a custom port for HTTP:
#
#http.port: 9200

http.cors.enabled : true
http.cors.allow-origin : "*"

# For more information, consult the network module documentation.
#
# --------------------------------- Discovery ----------------------------------
#
# Pass an initial list of hosts to perform discovery when new node is started:
# The default list of hosts is ["127.0.0.1", "[::1]"]
#
#discovery.zen.ping.unicast.hosts: ["host1", "host2"]
#
# Prevent the "split brain" by configuring the majority of nodes (total number of master-eligible nodes / 2 + 1):
#
#discovery.zen.minimum_master_nodes:
#
#cluster.initial_master_nodes: ["node-0"]
# For more information, consult the zen discovery module documentation.
#
# ---------------------------------- Gateway -----------------------------------
#
# Block initial recovery after a full cluster restart until N nodes are started:
#
#gateway.recover_after_nodes: 3
#
# For more information, consult the gateway module documentation.
#
# ---------------------------------- Various -----------------------------------
#
# Require explicit names when deleting indices:
#
#action.destructive_requires_name: true
-Xms128M
-Xmx128M
# /etc/security/limits.conf
#
#This file sets the resource limits for the users logged in via PAM.
#It does not affect resource limits of the system services.
#
#Also note that configuration files in /etc/security/limits.d directory,
#which are read in alphabetical order, override the settings in this
#file in case the domain is the same or more specific.
#That means for example that setting a limit for wildcard domain here
#can be overriden with a wildcard setting in a config file in the
#subdirectory, but a user specific setting here can be overriden only
#with a user specific setting in the subdirectory.
#
#Each line describes a limit for a user in the form:
#
#<domain>        <type>  <item>  <value>
#
#Where:
#<domain> can be:
#        - a user name
#        - a group name, with @group syntax
#        - the wildcard *, for default entry
#        - the wildcard %, can be also used with %group syntax,
#                 for maxlogin limit
#
#<type> can have the two values:
#        - "soft" for enforcing the soft limits
#        - "hard" for enforcing hard limits
#
#<item> can be one of the following:
#        - core - limits the core file size (KB)
#        - data - max data size (KB)
#        - fsize - maximum filesize (KB)
#        - memlock - max locked-in-memory address space (KB)
#        - nofile - max number of open file descriptors
#        - rss - max resident set size (KB)
#        - stack - max stack size (KB)
#        - cpu - max CPU time (MIN)
#        - nproc - max number of processes
#        - as - address space limit (KB)
#        - maxlogins - max number of logins for this user
#        - maxsyslogins - max number of logins on the system
#        - priority - the priority to run user process with
#        - locks - max number of file locks the user can hold
#        - sigpending - max number of pending signals
#        - msgqueue - max memory used by POSIX message queues (bytes)
#        - nice - max nice priority allowed to raise to values: [-20, 19]
#        - rtprio - max realtime priority
#
#<domain>      <type>  <item>         <value>
#

#*               soft    core            0
#*               hard    rss             10000
#@student        hard    nproc           20
#@faculty        soft    nproc           20
#@faculty        hard    nproc           50
#ftp             hard    nproc           0
#@student        -       maxlogins       4

* soft nofile 65536
* hard nofile 131072
* soft nproc 2048
* hard nproc 4096


# End of file
vim /etc/sysctl.conf
配置如下:
# sysctl settings are defined through files in
# /usr/lib/sysctl.d/, /run/sysctl.d/, and /etc/sysctl.d/.
#
# Vendors settings live in /usr/lib/sysctl.d/.
# To override a whole file, create a new file with the same in
# /etc/sysctl.d/ and put new settings there. To override
# only specific settings, add a file with a lexically later
# name in /etc/sysctl.d/ and put new settings there.
#
# For more information, see sysctl.conf(5) and sysctl.d(5).
#
vm.max_map_count=262145
配置生效
sysctl -p
8. 切换用户并启动ES
su esuser
cd /usr/local/elasticsearch-6.4.3/bin/
./elasticsearch
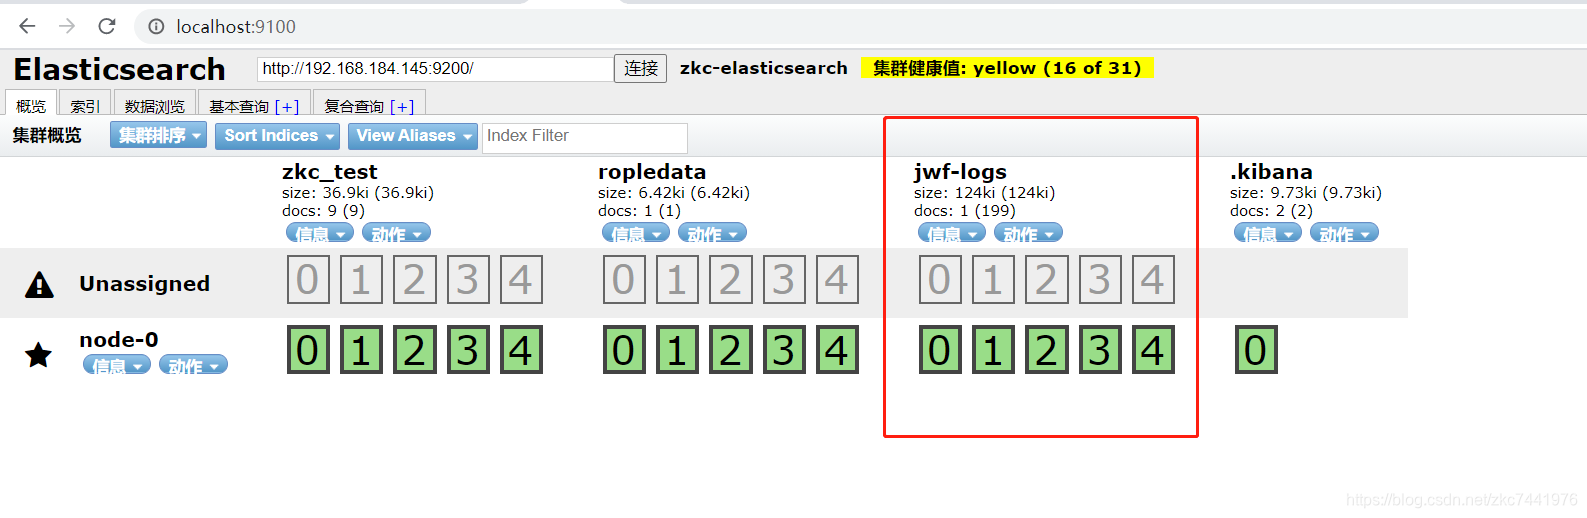
9. 启动后查看控制台,并访问ES http://192.168.184.145:9200

去官网下载压缩包,本文以logstash-6.4.3.tar.gz为例
input{
jdbc{
# 设置 MySql/MariaDB 数据库url以及数据库名称
jdbc_connection_string => "jdbc:oracle:thin:@172.16.4.29:1521:urpdb"
# 用户名和密码
jdbc_user => "USR_JWJC_DEV"
jdbc_password => "JWJCDEV1234"
# 数据库驱动所在位置,可以是绝对路径或者相对路径
jdbc_driver_library => "/usr/local/logstash-6.4.3/sync/ojdbc8-12.2.0.1.jar"
# 驱动类名
jdbc_driver_class => "Java::oracle.jdbc.driver.OracleDriver"
# 开启分页
jdbc_paging_enabled => "true"
# 分页数量
jdbc_page_size => "1000"
# 执行的sql文件路径
statement_filepath => "/usr/local/logstash-6.4.3/sync/jwf_log.sql"
# 设置任务间隔 含义:分 时 天 月 年 全部*默认每分钟跑一次
schedule => "* * * * *"
# 索引类型
type => "_doc"
# 是否开启记录上次追踪的结果
use_column_value => true
# 记录上次追踪的结果值
last_run_metadata_path => "/usr/local/logstash-6.4.3/sync/track_time"
# 追踪字段名称
tracking_column => "ID"
# 追踪字段类型
tracking_column_type => "numeric"
# 是否清除追踪记录
clean_run => false
# 数据库字段名称大写转小写
lowercase_column_names => false
}
}
output{
# es配置
elasticsearch{
# es地址
hosts => ["192.168.184.145:9200"]
# 索引库名称
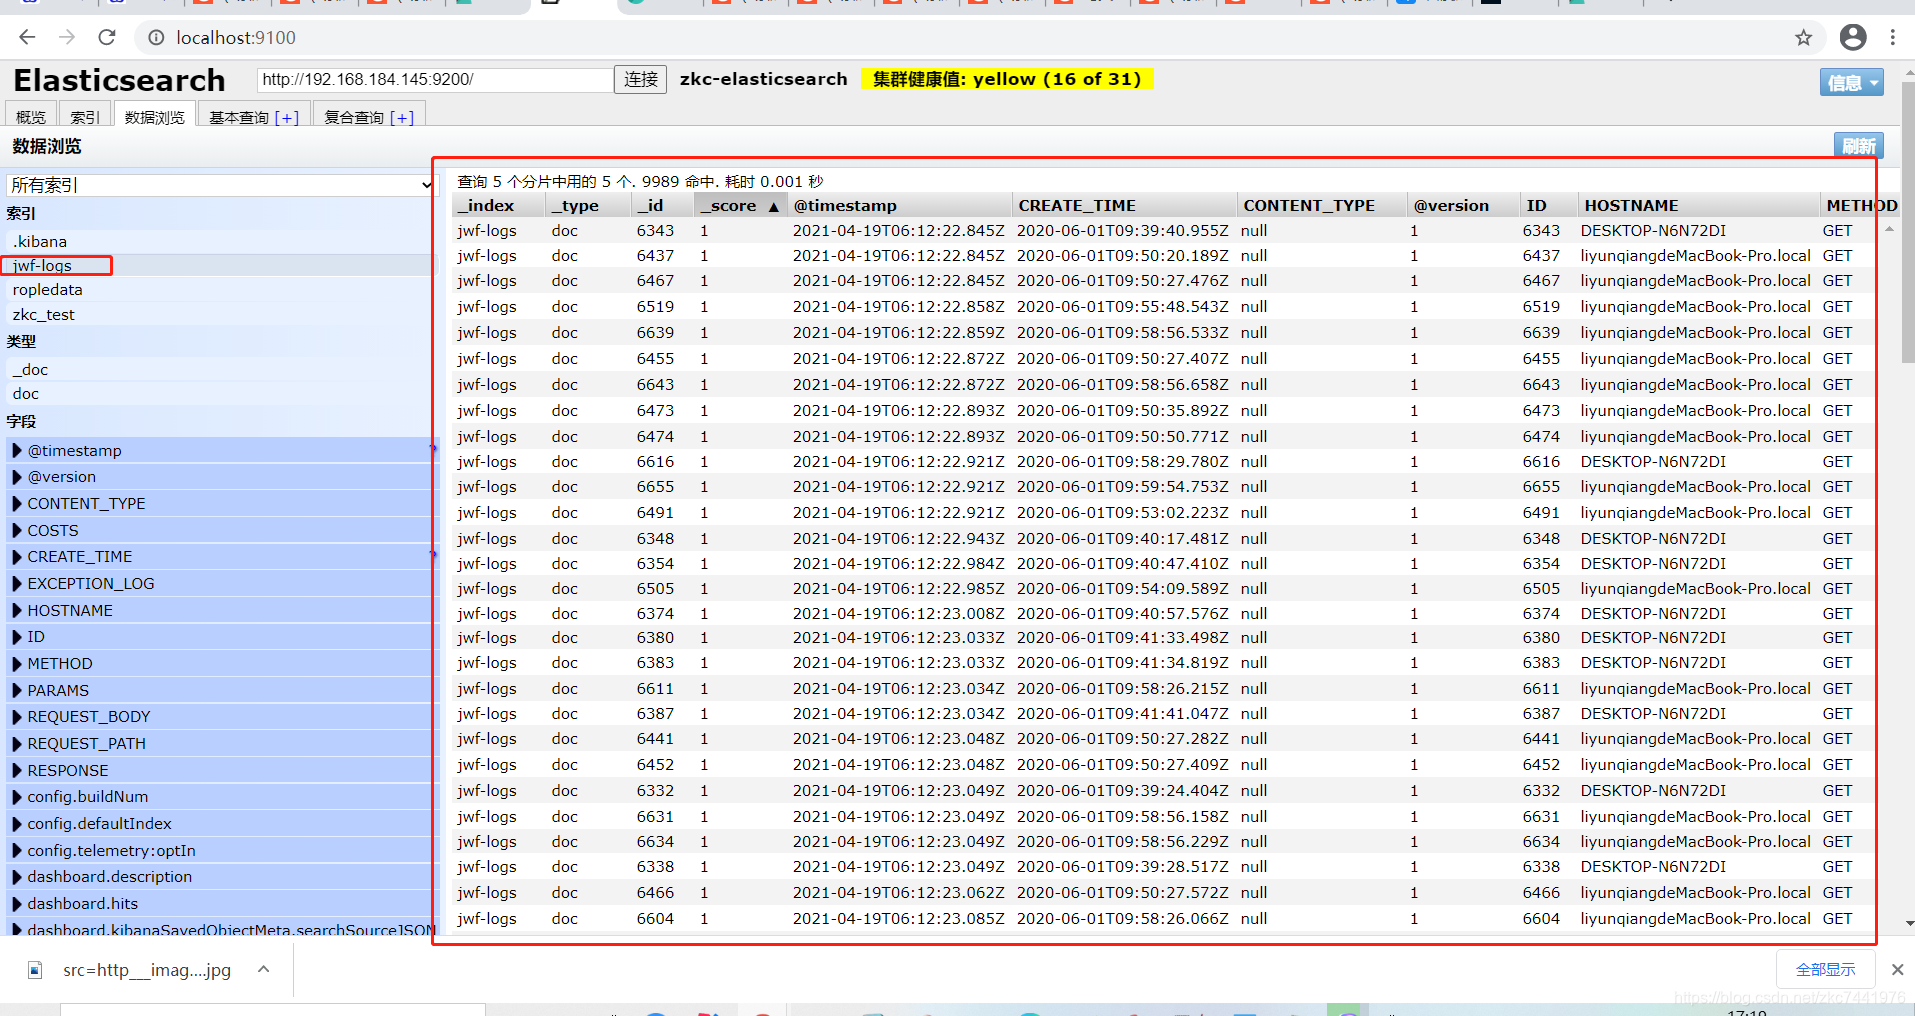
index => "jwf-logs"
# 设置索引ID
document_id => "%{ID}"
}
# 日志输出
stdout{
codec => json_lines
}
}

SELECT * from T_SYSTEM_REQUEST_LOG WHERE ID > :sql_last_value
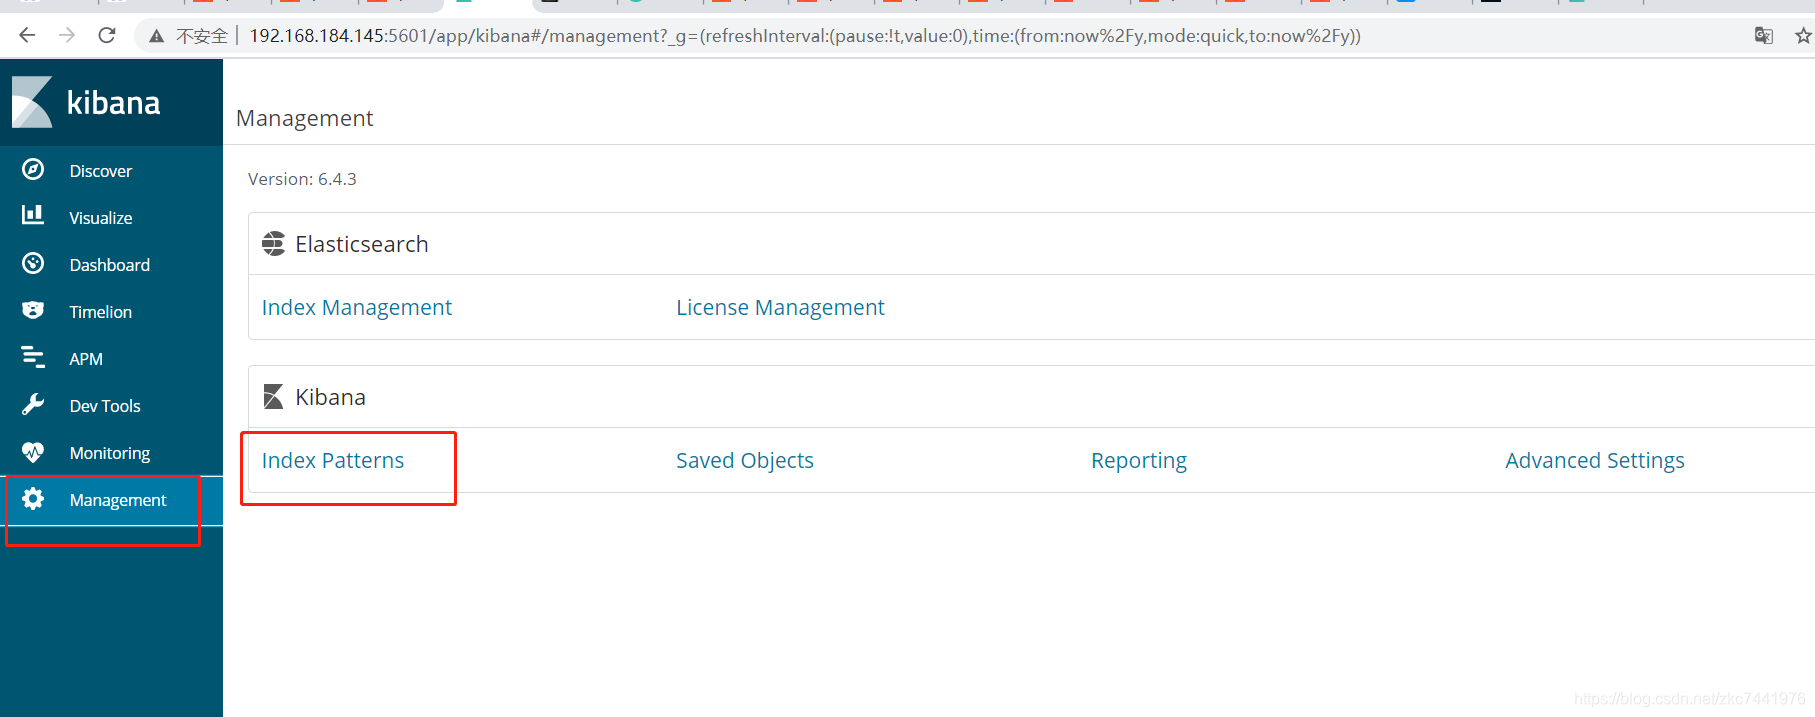
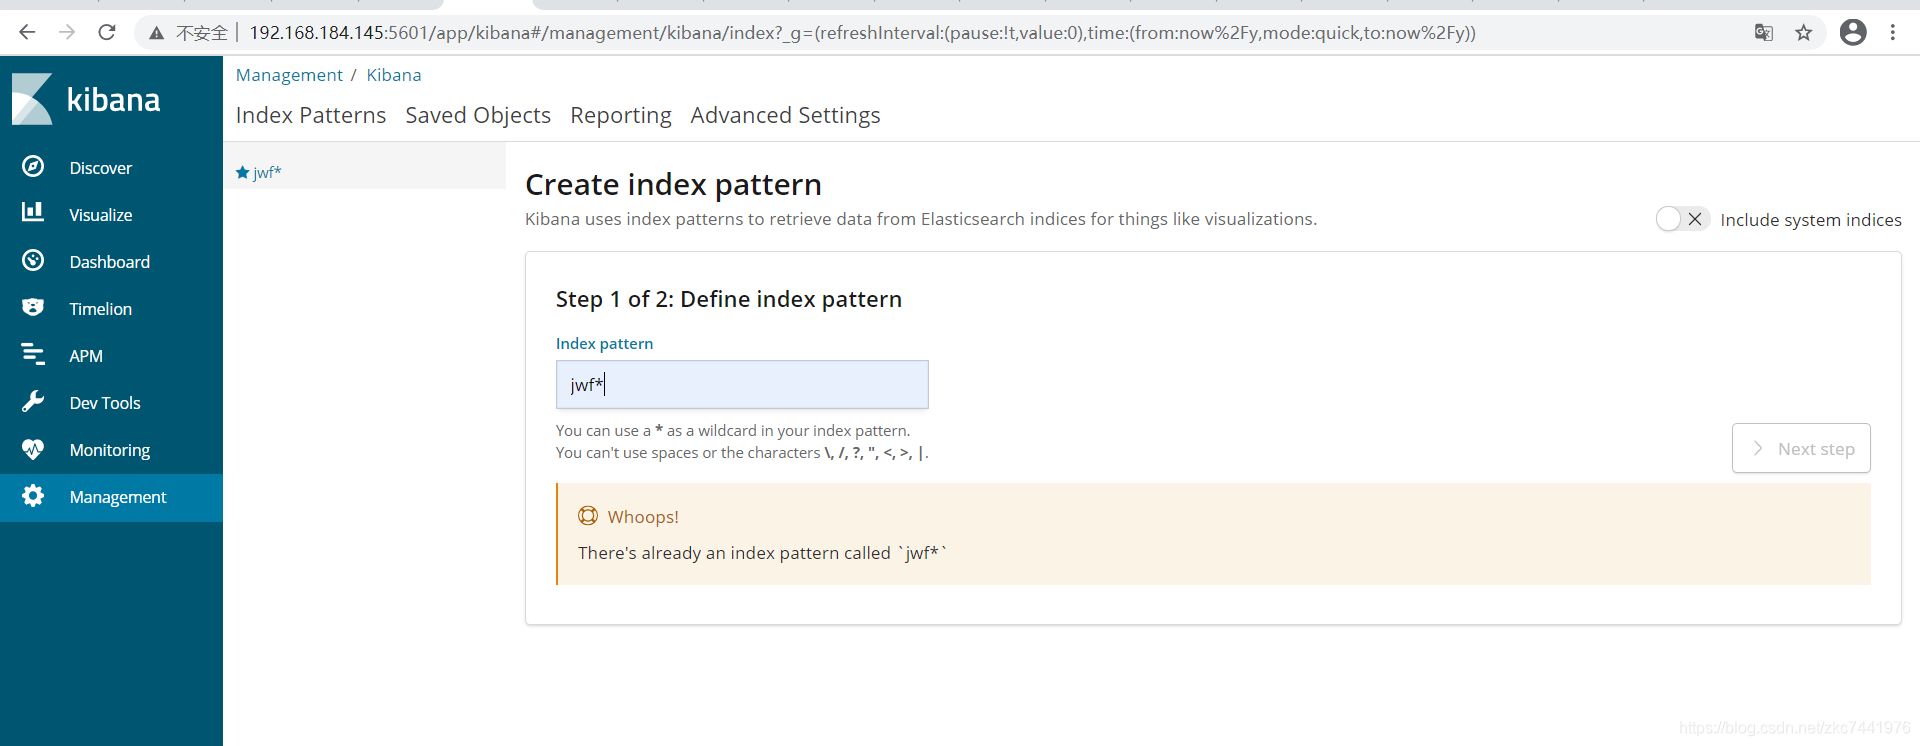
去官网下载压缩包,本案例中以kibana-6.4.3-linux-x86_64.tar.gz为例。
# Kibana is served by a back end server. This setting specifies the port to use.
#server.port: 5601

# Specifies the address to which the Kibana server will bind. IP addresses and host names are both valid values.
# The default is 'localhost', which usually means remote machines will not be able to connect.
# To allow connections from remote users, set this parameter to a non-loopback address.
server.host: "192.168.184.145"

# Enables you to specify a path to mount Kibana at if you are running behind a proxy.
# Use the `server.rewriteBasePath` setting to tell Kibana if it should remove the basePath
# from requests it receives, and to prevent a deprecation warning at startup.
# This setting cannot end in a slash.
#server.basePath: ""

# Specifies whether Kibana should rewrite requests that are prefixed with
# `server.basePath` or require that they are rewritten by your reverse proxy.
# This setting was effectively always `false` before Kibana 6.3 and will
# default to `true` starting in Kibana 7.0.
#server.rewriteBasePath: false

# The maximum payload size in bytes for incoming server requests.
#server.maxPayloadBytes: 1048576

# The Kibana server's name.  This is used for display purposes.
#server.name: "your-hostname"

# The URL of the Elasticsearch instance to use for all your queries.
elasticsearch.url: "http://192.168.184.145:9200"

# When this setting's value is true Kibana uses the hostname specified in the server.host
# setting. When the value of this setting is false, Kibana uses the hostname of the host
# that connects to this Kibana instance.
#elasticsearch.preserveHost: true

# Kibana uses an index in Elasticsearch to store saved searches, visualizations and
# dashboards. Kibana creates a new index if the index doesn't already exist.
#kibana.index: ".kibana"

# The default application to load.
#kibana.defaultAppId: "home"

# If your Elasticsearch is protected with basic authentication, these settings provide
# the username and password that the Kibana server uses to perform maintenance on the Kibana
# index at startup. Your Kibana users still need to authenticate with Elasticsearch, which
# is proxied through the Kibana server.
#elasticsearch.username: "user"
#elasticsearch.password: "pass"

# Enables SSL and paths to the PEM-format SSL certificate and SSL key files, respectively.
# These settings enable SSL for outgoing requests from the Kibana server to the browser.
#server.ssl.enabled: false
#server.ssl.certificate: /path/to/your/server.crt
#server.ssl.key: /path/to/your/server.key

# Optional settings that provide the paths to the PEM-format SSL certificate and key files.
# These files validate that your Elasticsearch backend uses the same key files.
#elasticsearch.ssl.certificate: /path/to/your/client.crt
#elasticsearch.ssl.key: /path/to/your/client.key

# Optional setting that enables you to specify a path to the PEM file for the certificate
# authority for your Elasticsearch instance.
#elasticsearch.ssl.certificateAuthorities: [ "/path/to/your/CA.pem" ]

# To disregard the validity of SSL certificates, change this setting's value to 'none'.
#elasticsearch.ssl.verificationMode: full

# Time in milliseconds to wait for Elasticsearch to respond to pings. Defaults to the value of
# the elasticsearch.requestTimeout setting.
#elasticsearch.pingTimeout: 1500

# Time in milliseconds to wait for responses from the back end or Elasticsearch. This value
# must be a positive integer.
#elasticsearch.requestTimeout: 30000

# List of Kibana client-side headers to send to Elasticsearch. To send *no* client-side
# headers, set this value to [] (an empty list).
#elasticsearch.requestHeadersWhitelist: [ authorization ]

# Header names and values that are sent to Elasticsearch. Any custom headers cannot be overwritten
# by client-side headers, regardless of the elasticsearch.requestHeadersWhitelist configuration.
#elasticsearch.customHeaders: {}

# Time in milliseconds for Elasticsearch to wait for responses from shards. Set to 0 to disable.
#elasticsearch.shardTimeout: 30000

# Time in milliseconds to wait for Elasticsearch at Kibana startup before retrying.
#elasticsearch.startupTimeout: 5000

# Logs queries sent to Elasticsearch. Requires logging.verbose set to true.
#elasticsearch.logQueries: false

# Specifies the path where Kibana creates the process ID file.
#pid.file: /var/run/kibana.pid

# Enables you specify a file where Kibana stores log output.
#logging.dest: stdout

# Set the value of this setting to true to suppress all logging output.
#logging.silent: false

# Set the value of this setting to true to suppress all logging output other than error messages.
#logging.quiet: false

# Set the value of this setting to true to log all events, including system usage information
# and all requests.
#logging.verbose: false

# Set the interval in milliseconds to sample system and process performance
# metrics. Minimum is 100ms. Defaults to 5000.
#ops.interval: 5000

# The default locale. This locale can be used in certain circumstances to substitute any missing
# translations.
#i18n.defaultLocale: "en"

ADO对象: Connection Command Recordset Record Stream ASP支持的对象很多,可...
微信文件传输助手是微信电脑版与手机微信之间相互传输图片等文件的好工具,但很...
vbs:把一段文字中指定字符颜色变成红色的正则 functionc(Tstr,Word) Dimre Setre...
一石激起千层浪,继中国区浩浩荡荡的大裁员告一段落之后,甲骨文并未因此收起手...
歌词编辑器 歌词编辑器 第一步:选择要播放的歌曲并播放 第二步:填写全部的歌词...
【排序算法】之lowb三人组冒泡、插入、选择 什么是lowb三人组 冒泡排序bubble so...
一、正则表达式概述 二、正则表达式在VBScript中的应用 三、正则表达式在VavaScr...
计算属性computed: 支持缓存,只有依赖数据发生改变,才会重新进行计算 不支持...
前言 相信大家都知道在IDE中代码的智能提示几乎都是标配,虽然一些文本编辑器也...
本文将研究 ES6 的 for ... of 循环。 旧方法 在过去,有两种方法可以遍历 javas...