ggplot2带你轻松绘制旭日图

欢迎关注R语言数据分析指南
?之前在会员交流群内看到有朋友询问旭日图的绘制方法,本节来介绍如何使用ggplot2来绘制并添加内外圈,下面小编就通过一个案例来进行展示数据为随意构建无实际意义仅作图形展示用,添加了详细的注释希望各位观众老爷能够喜欢 ?加载R包
library(tidyverse)
library(ggtext)
导入数据
outer_ring <- read_tsv("outer_ring.xls")
inner_ring <- read_tsv("data.xls")
案例1
ggplot()+
  geom_rect(data = inner_ring,
    aes(xmin = 0.5, xmax = 1.5, ymin = ymin, ymax = ymax, fill = character2),
    alpha = 1, color = "white", linewidth = 0.42)+
  annotate("rect", xmin = 0, xmax = 0.75, ymin = -Inf, ymax = Inf, fill = "grey")+
  annotate("text",x = 0, y = 0, label = "The Office",fontface = "plain", color = "grey10", size = 7)+
  geom_text(data = inner_ring,aes(x = ifelse(words_share > 0.05, 1.1, 1.9),
      y = ymin + (ymax - ymin) / 2,
      label = character2,
      size = ifelse(words_share > 0.05, 4, 3.5),
      vjust = ifelse(words_share > 0.05, 0.5, -0.7)),hjust = 0.5)+
  scale_size_identity() +
  scale_color_identity() +
  coord_polar(theta = "y", clip = "off", start = -0.005) +
  labs(title =NULL) +
  theme_void() +
  theme(plot.background = element_rect(color = "white", fill = "white"),
    text = element_text(color ="black"),
    legend.title = element_blank(),
    plot.margin = margin(t = 0, b = 0, l = 4, r = 4))

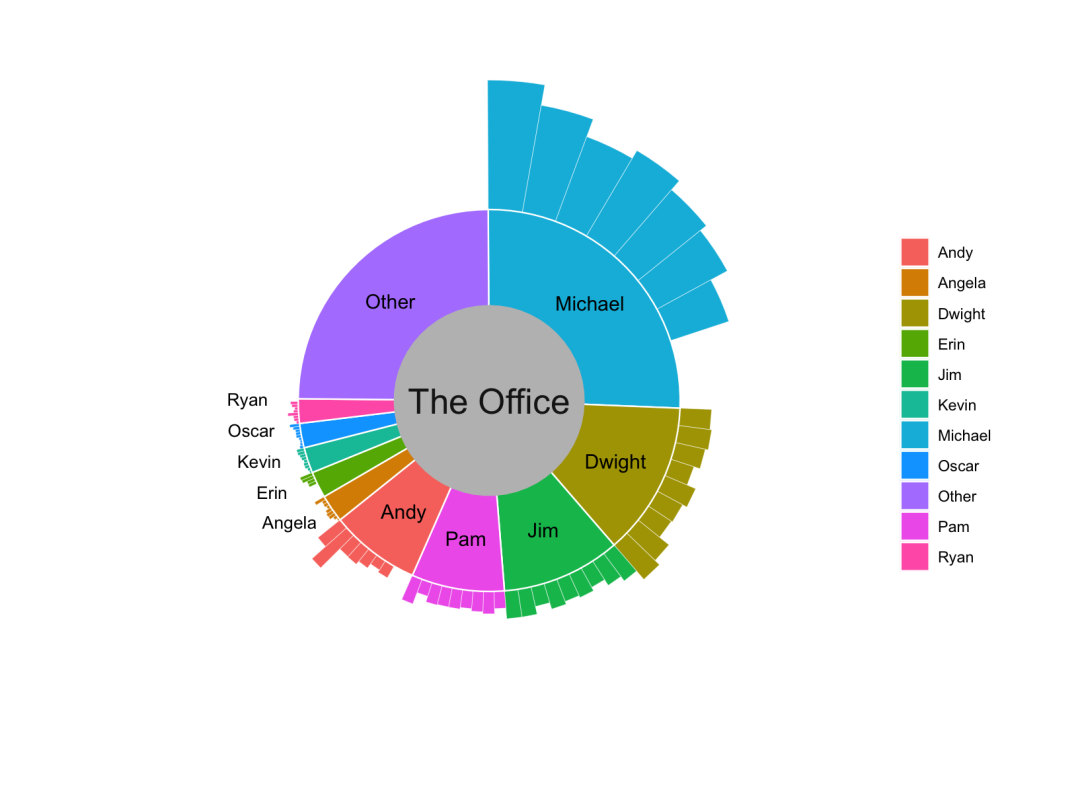
案例2
ggplot()+
  geom_rect(data = outer_ring,
    aes(xmin = 0.25, xmax = 1.5 + 2 * words_share.season,
        ymin = ymin, ymax = ymax, fill = character2), color = "white", linewidth = 0.1)+
  geom_rect(data = inner_ring,
    aes(xmin = 0.5, xmax = 1.5, ymin = ymin, ymax = ymax, fill = character2),
    alpha = 1, color = "white", linewidth = 0.42)+
  annotate("rect", xmin = 0, xmax = 0.75, ymin = -Inf, ymax = Inf, fill = "grey")+
  annotate("text",x = 0, y = 0, label = "The Office",fontface = "plain", color = "grey10", size = 7)+
  geom_text(data = inner_ring,aes(x = ifelse(words_share > 0.05, 1.1, 1.9),
      y = ymin + (ymax - ymin) / 2,
      label = character2,
      size = ifelse(words_share > 0.05, 4, 3.5),
      vjust = ifelse(words_share > 0.05, 0.5, -0.7)),hjust = 0.5)+
  scale_size_identity() +
  scale_color_identity() +
  coord_polar(theta = "y", clip = "off", start = -0.005) +
  labs(title =NULL) +
  theme_void() +
  theme(plot.background = element_rect(color = "white", fill = "white"),
    text = element_text(color ="black"),
    legend.title = element_blank(),
    plot.margin = margin(t = 0, b = 0, l = 4, r = 4))
本文参与?腾讯云自媒体分享计划,分享自微信公众号。
原始发表:2023-08-07,如有侵权请联系?cloudcommunity@tencent.com 删除
评论
登录后参与评论
推荐阅读
目录