使用Perf诊断PostgreSQL性能问题
使用Perf诊断PostgreSQL性能问题

1 编译参数
使用perf获取完整的堆栈信息需要下面几个编译参数:
-O0:编译器不做优化-ggdb3:增加了为GDB优化的调试信息,级别是3-g3:增加了调试信息,级别是3-fno-omit-frame-pointer:保留完成的栈帧
但偏向于debug的参数会造成性能降低,生产上也不一定这样编,部分堆栈缺失也不妨碍整体性能分析。
一个例子:
./configure --prefix=/pathto --enable-tap-tests --with-tcl --enable-depend --enable-cassert --enable-debug --with-perl --with-openssl --with-libxml CFLAGS="-O0 -ggdb3 -g3 -fno-omit-frame-pointer"2 函数与地址的关系
perf使用符号表将地址对应到函数名,这里简单总结下函数地址的查看方法。
以exec_simple_query函数为例,这是PG中的一个函数,编译在postgres中,可以使用一些工具拿到函数地址:00000000009f1760
# nm /data02/mingjie/pgroot99/pghome/bin/postgres | grep exec_simple_query
00000000009f1760 t exec_simple_query

# readelf -s /data02/mingjie/pgroot99/pghome/bin/postgres | grep exec_simple_query
 15588: 00000000009f1760  1712 FUNC    LOCAL  DEFAULT   13 exec_simple_query

# objdump -t /data02/mingjie/pgroot99/pghome/bin/postgres | grep exec_simple_query
00000000009f1760 l F .text 00000000000006b0 exec_simple_query实际运行时,加载到内存中时,因为每个进程有自己的私有内存地址空间,所以函数地址就会用0x9f1760
gdb -p 2591493
(gdb) info address exec_simple_query
Symbol "exec_simple_query" is a function at address 0x9f1760.

(gdb) p exec_simple_query
$1 = {void (const char *)} 0x9f1760 <exec_simple_query>

(gdb) x/32 0x9f1750
0x9f1750 <pg_plan_queries+331>:	-1065091072	-18971377	-1958150145	-1010173883
0x9f1760 <exec_simple_query>:	-443987883	-521371320	1207959552	-14107255
0x9f1770 <exec_simple_query+16>:	93061119	8198448	266093961	127206838
0x9f1780 <exec_simple_query+32>:	1166540927	-280639781	-2054469632	-216
0x9f1790 <exec_simple_query+48>:	1761970504	1207992691	-14121589	-1991704577
0x9f17a0 <exec_simple_query+64>:	180166	-2048393216	-2147483066	1946213245
0x9f17b0 <exec_simple_query+80>:	1345382405	-1243086848	-402653145	10635
0x9f17c0 <exec_simple_query+96>:	-519730360	1207992077	-521615479	1224736753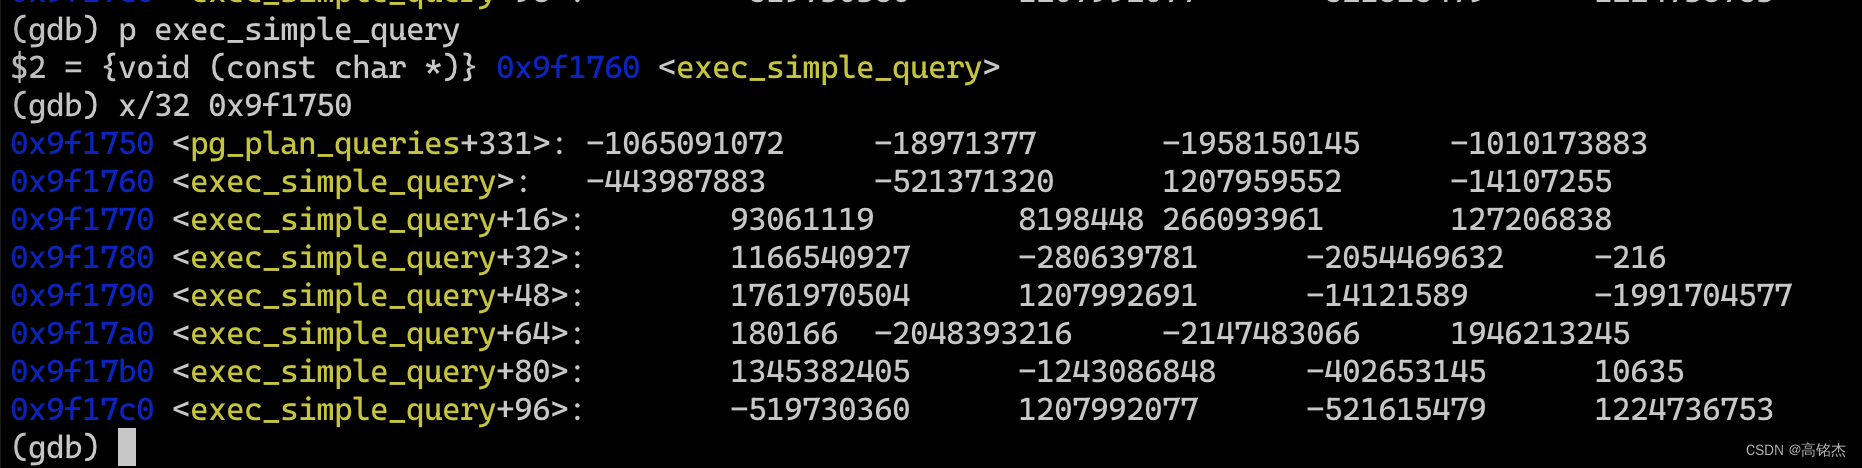
使用pmap查看PG进程后,发现
- PG的函数加载到
400000 - 11bc000地址范围内 - PG的静态库加载到
11bc000 - 11bd000地址范围内 - PG的全局变量加载到
11bd000 - 11d8000和11d8000 - 2041000地址范围内 - 后面是一些malloc、共享内存映射等拿到的地址空间。
- 整体用户态空间在
0 - ffffffffff600000范围内,高地址放栈、低地址放代码和堆。
# pmap 2591493
2591493:   postgres: mingjie postgres [local] idle
0000000000400000  12020K r-x-- postgres    -- 函数

    -- 00000000009f1760  1712 FUNC    LOCAL  DEFAULT   13 exec_simple_query

00000000011bc000      4K r---- postgres     -- 静态库

    -- 00000000011bcce0    24 OBJECT  GLOBAL DEFAULT   20 xmlIsDigitGroup@LIBXML2_2.6.0 (6)
    -- 00000000011bccc0    24 OBJECT  GLOBAL DEFAULT   20 xmlIsExtenderGroup@LIBXML2_2.6.0 (6)
    -- 00000000011bcd30    24 OBJECT  GLOBAL DEFAULT   20 xmlIsBaseCharGroup@LIBXML2_2.6.0 (6)
    -- 00000000011bcd20    16 OBJECT  WEAK   DEFAULT   20 in6addr_any@GLIBC_2.2.5 (3)

00000000011bd000    108K rw--- postgres     -- 全局变量 extern PGDLLIMPORT ...

    -- 00000000011c2d4e     1 OBJECT  GLOBAL DEFAULT   24 enable_async_append
    -- 00000000011c2d5c     4 OBJECT  GLOBAL DEFAULT   24 constraint_exclusion
    -- 00000000011c2a27     1 OBJECT  GLOBAL DEFAULT   24 log_checkpoints

    -- 00000000011bcce0    24 OBJECT  GLOBAL DEFAULT   20 xmlIsDigitGroup@LIBXML2_2.6.0 (6)
    -- 00000000011be9a0     1 OBJECT  GLOBAL DEFAULT   24 synchronize_seqscans
    -- 00000000011be9d0     4 OBJECT  GLOBAL DEFAULT   24 ParallelWorkerNumber


00000000011d8000    216K rw---   [ anon ]   -- 全局变量 extern PGDLLIMPORT ...

    -- 0000000001207368     1 OBJECT  GLOBAL DEFAULT   25 pg_krb_caseins_users
    -- 00000000011d8150     4 OBJECT  GLOBAL DEFAULT   25 binary_upgrade_next_array
    -- 00000000011dd5b8     1 OBJECT  GLOBAL DEFAULT   25 pgstat_track_activities
    -- 00000000011e2588     8 OBJECT  GLOBAL DEFAULT   25 TopMemoryContext

0000000002041000    412K rw---   [ anon ]
    -- 无
00000000020a8000    916K rw---   [ anon ]
    -- 无
00007fdb78d2b000    260K rw---   [ anon ]
00007fdb78d6c000   1024K rw-s- PostgreSQL.1707624748
00007fdb78e6c000   2312K rw---   [ anon ]
00007fdb790ae000 326000K rw-s- zero (deleted)
00007fdb8cf0a000   2528K r---- LC_COLLATE
00007fdb8d182000     92K r-x-- libgcc_s-8-20210514.so.1
00007fdb8d199000   2044K ----- libgcc_s-8-20210514.so.1
00007fdb8d398000      4K r---- libgcc_s-8-20210514.so.1
00007fdb8d399000      4K rw--- libgcc_s-8-20210514.so.1
00007fdb8d39a000   1560K r-x-- libstdc++.so.6.0.25
00007fdb8d520000   2044K ----- libstdc++.so.6.0.25
00007fdb8d71f000     48K r---- libstdc++.so.6.0.25
00007fdb8d72b000      4K rw--- libstdc++.so.6.0.25
...
00007ffcd99dc000      8K r-x--   [ anon ]
ffffffffff600000      4K r-x--   [ anon ]
 total           420376K
3 PERF TOP
准备压测
drop table t1;
create table t1(c1 serial8 primary key, c2 text, c3 timestamp);
insert into t1 select i, md5(random()::text), now() from generate_series(1, 1000000) t(i);
test.sql
\set aid random(1, 1000000)
select * from t1 where c1 = :aid;
压测开始
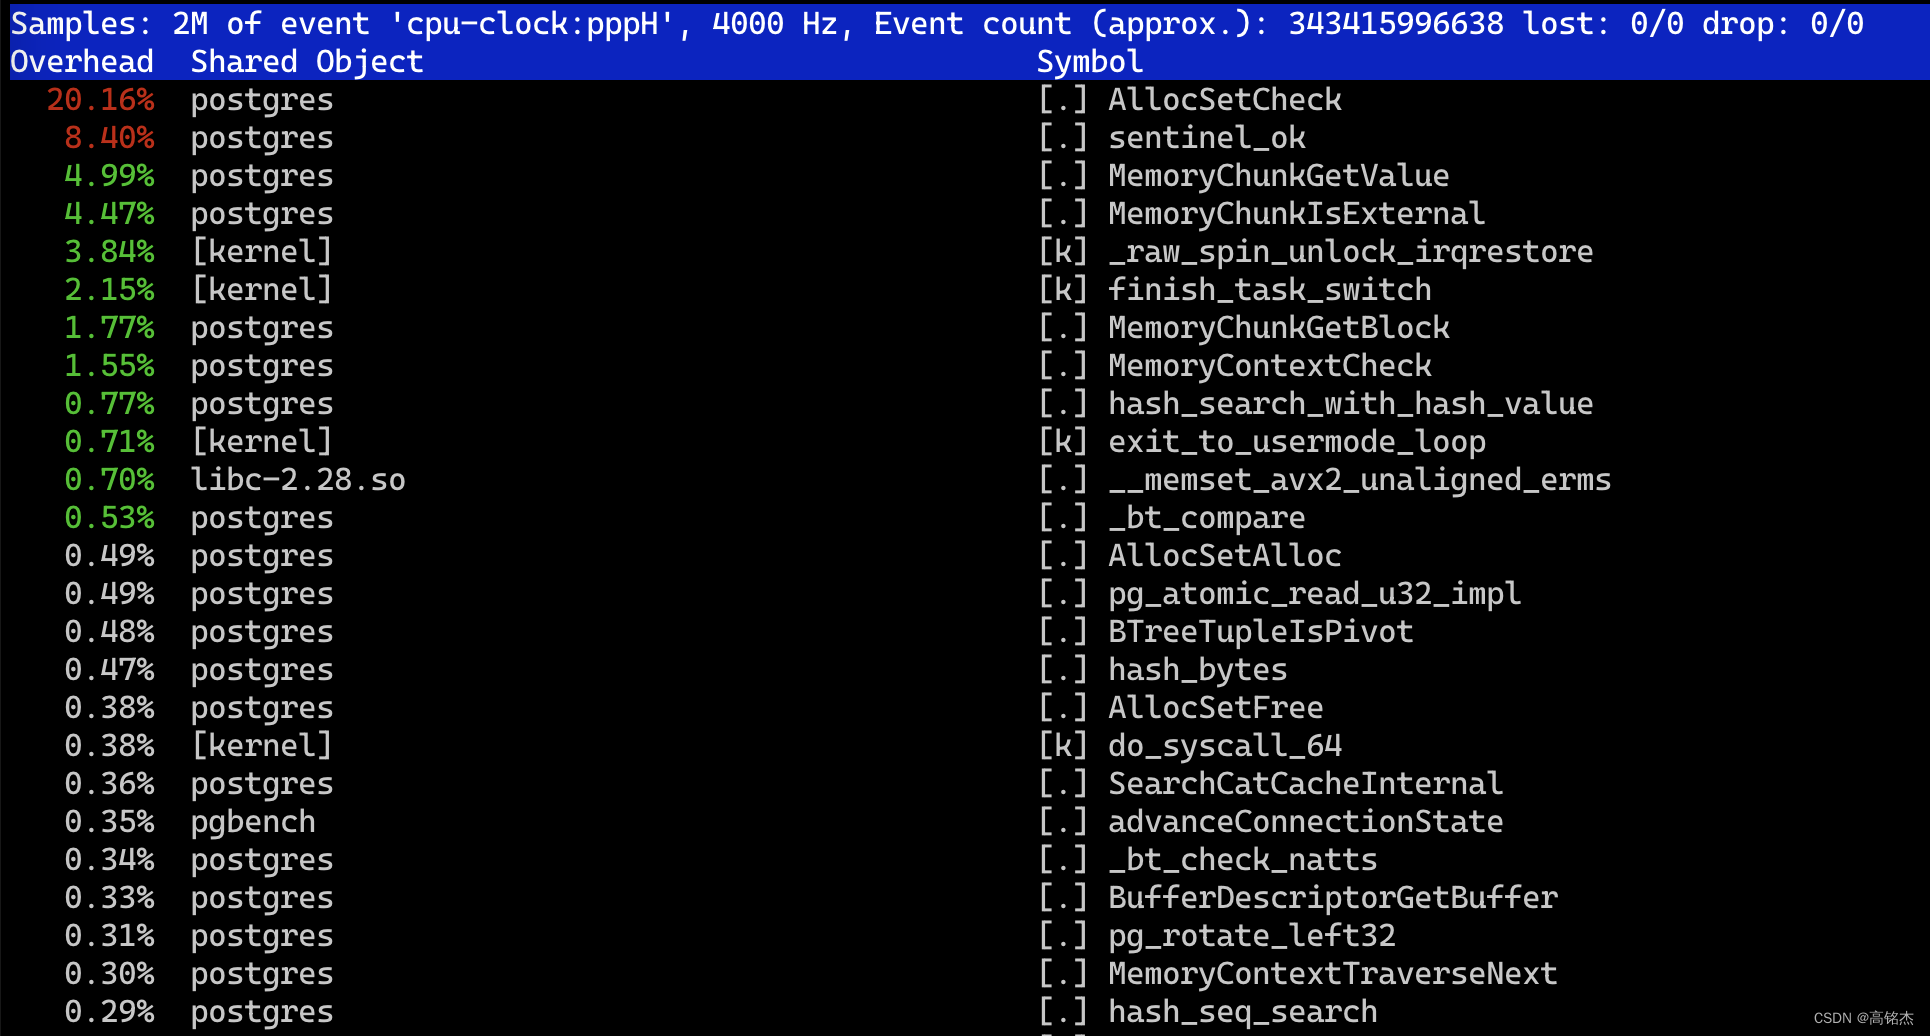
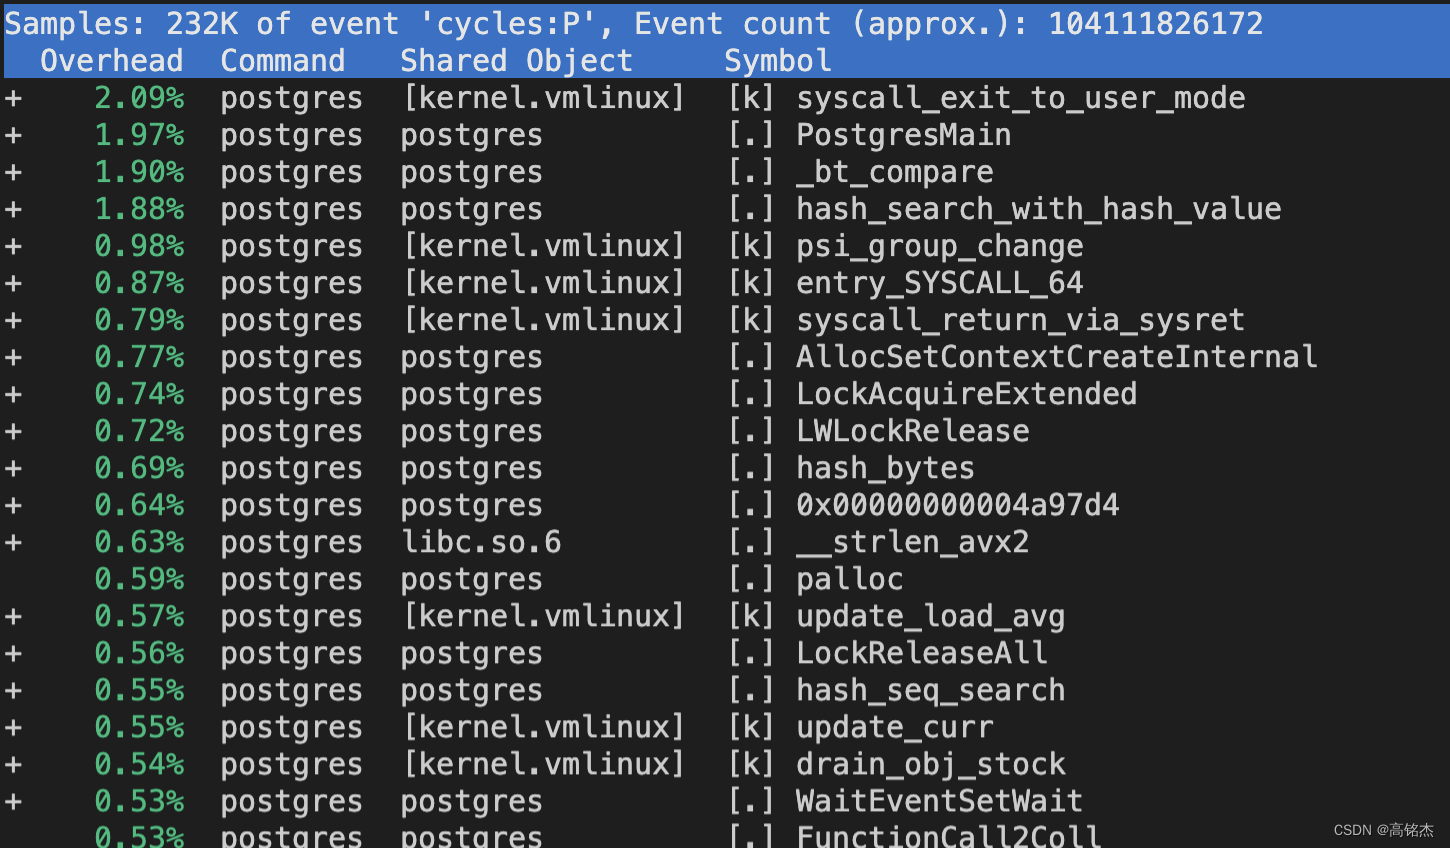
pgbench -M prepared -nr -P 1 -f test.sql -c 32 -j 32 -T 600perf top 观测1
注意这里的Overhead全部是Self的,也就是函数自己在采样中出现的百分比。
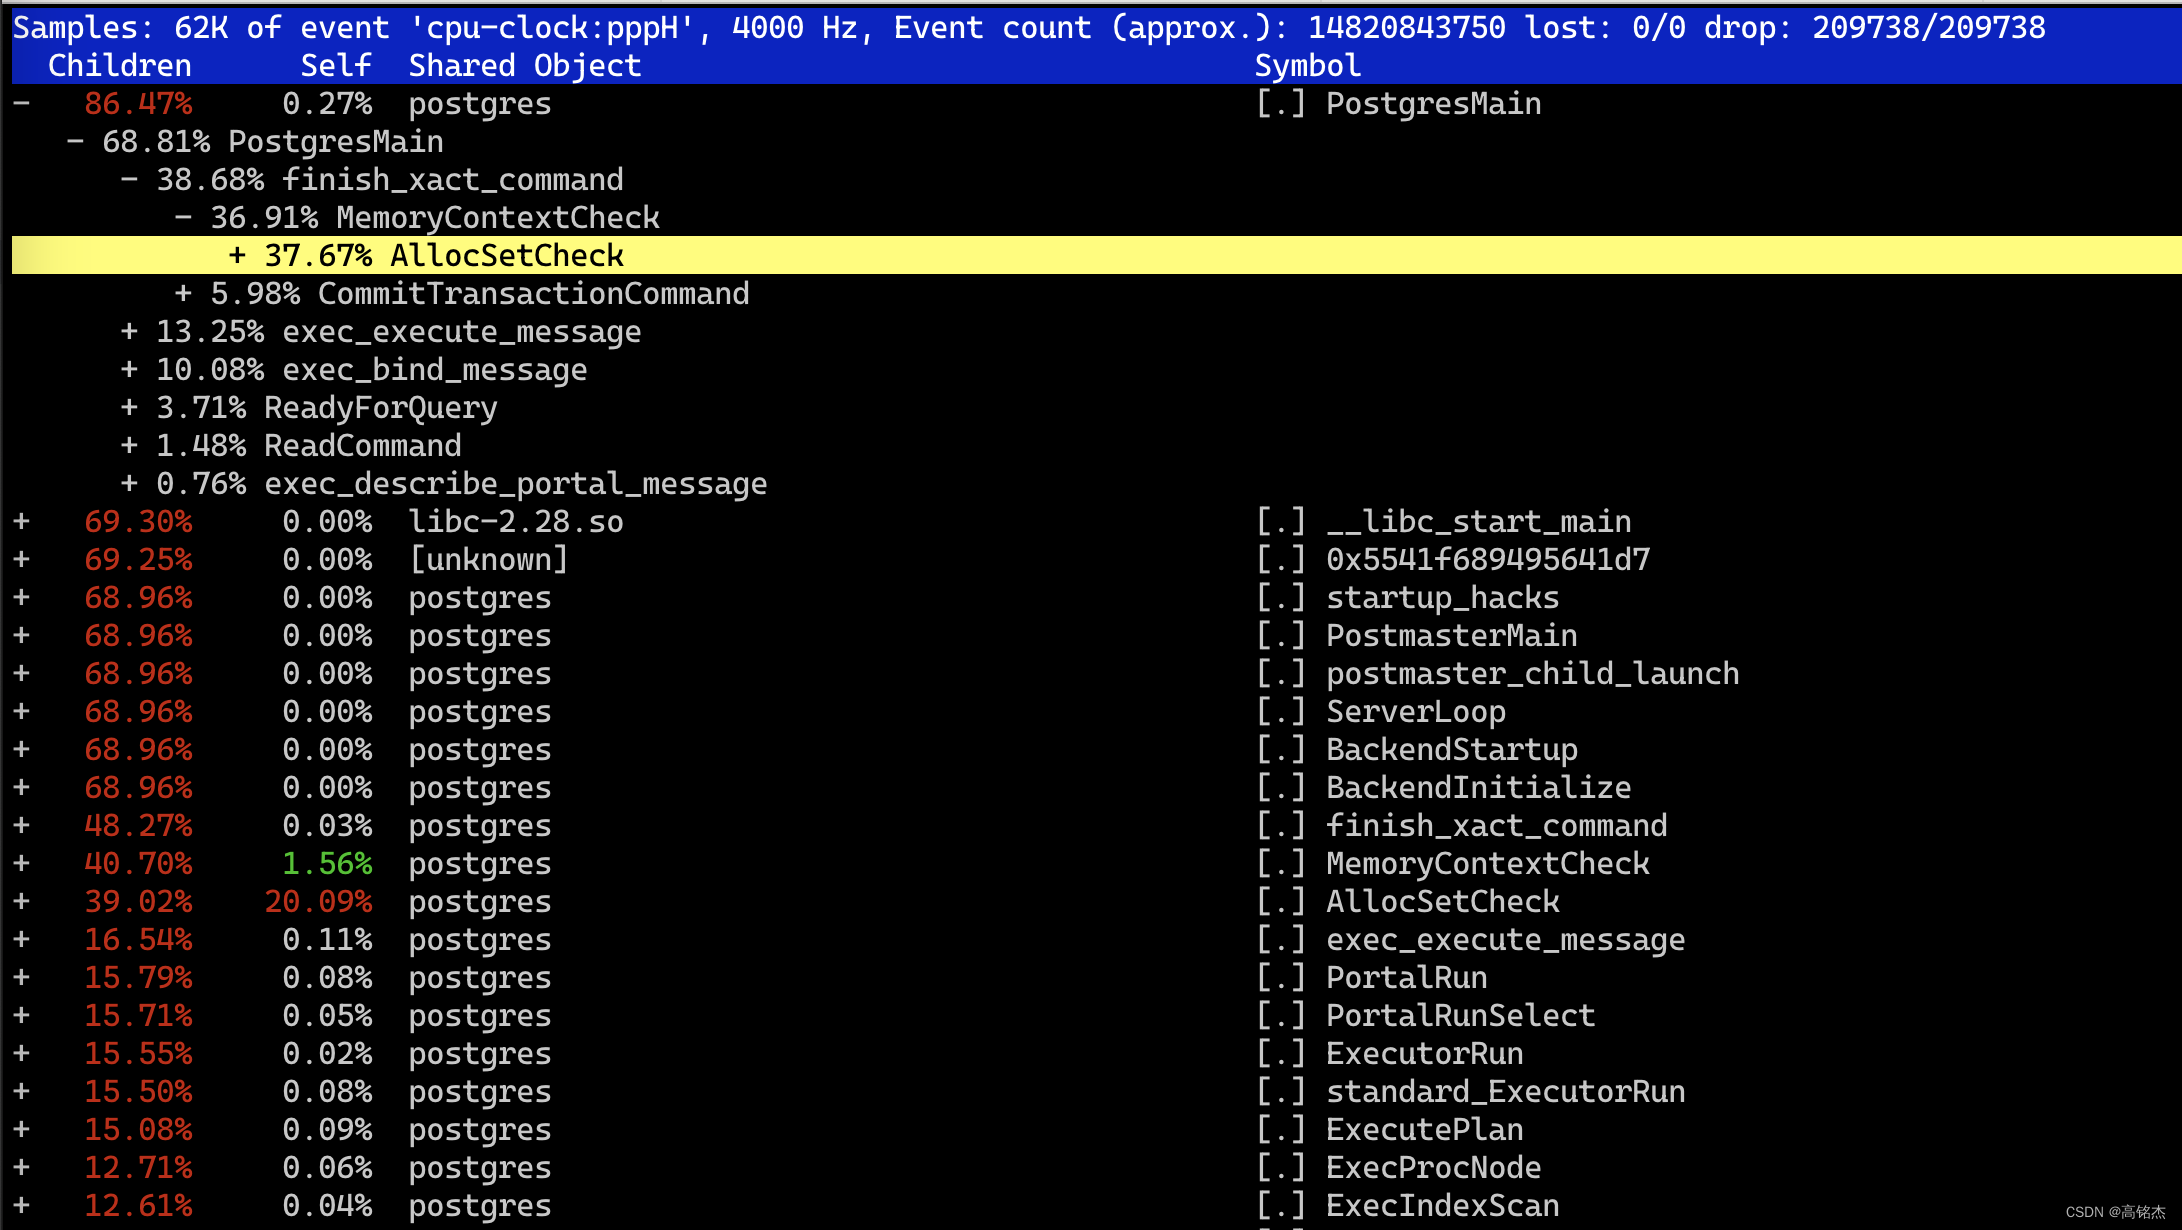
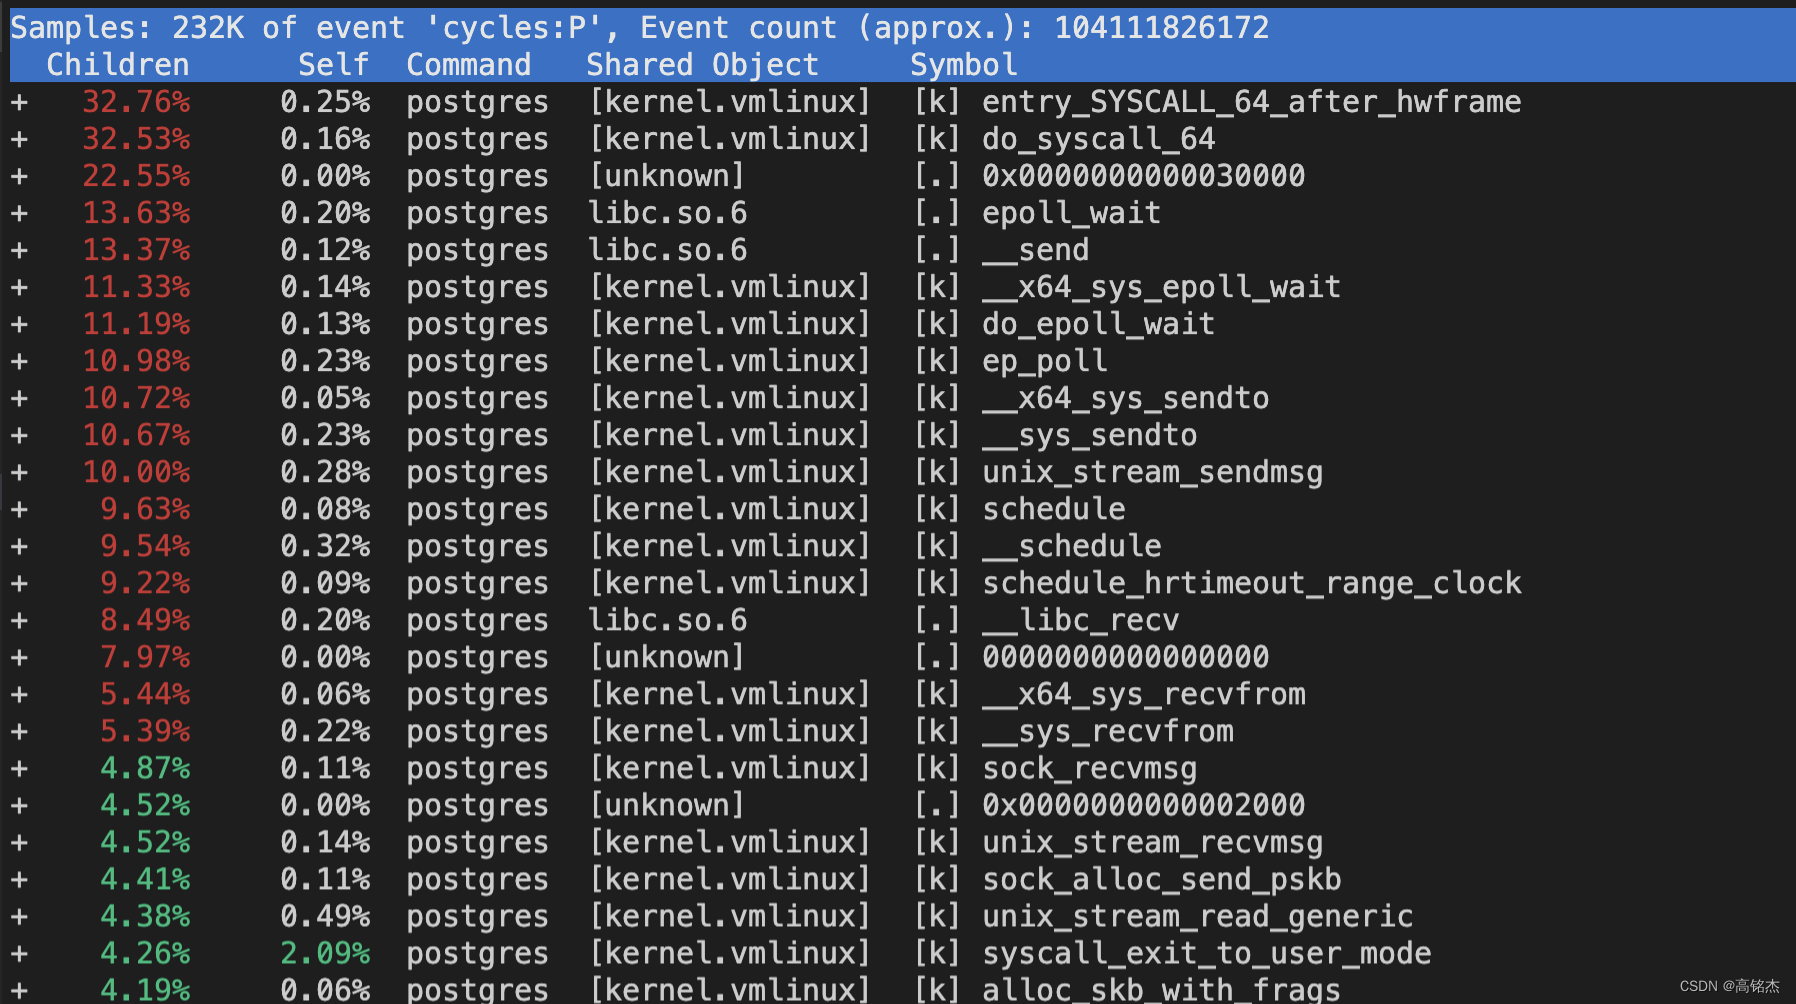
perf top -g 观测2
这里会看到Children和Self两列,怎么理解呢?
- Self:当前函数本身的代码上消耗CPU时间的百分比,不包括它调用的其他函数的时间。
- Children:当前函数以及它调用的所有函数上消耗的CPU时间的总和的百分比。
如果一个函数的Self时间很高意味着函数本身的代码效率低下。如果一个函数的Children时间很高,但Self时间相对较低,可能意味着它调用的一个或多个子函数是性能瓶颈。
例如下面可以看到AllocSetCheck的Self时间20.09%(注意这里是按Children来排序的)而第一个PostgresMain的Children占用86.47%,但Self只有0.27%,说明PostgresMain本身的占比很低,但他调用的函数占比很高,加起来有86.47%了,其中之一就是AllocSetCheck。
注意:children的百分比都是相对于parent的百分比,例如:
-   60.00%  A
     - 30.00%  B
     - 20.00%  C
函数 A 总执行时间的 60%。这包括它自己的代码执行时间以及它调用的所有函数的执行时间。 函数 B 是 A 的一个子函数,它单独占用了 A 执行时间的 30%。 函数 C 也是 A 的一个子函数,它占用了 A 执行时间的 20%。
4 PERF RECORD / PERF REPORT
一般PG独占物理机时,偏IO的业务不会占用很高的CPU,perf看整机不太好看到瓶颈。一般可以指定观测某个PG进程来确认进程瓶颈点,有没有提升空间。
采样某个进程的情况,采样60秒。
perf record -p 86684 -ag -- sleep 60大部分信息直接看就好了,没必要火焰图。
- 按SELF排序:
perf report --no-children
- 按CHILDREN排序:
perf report
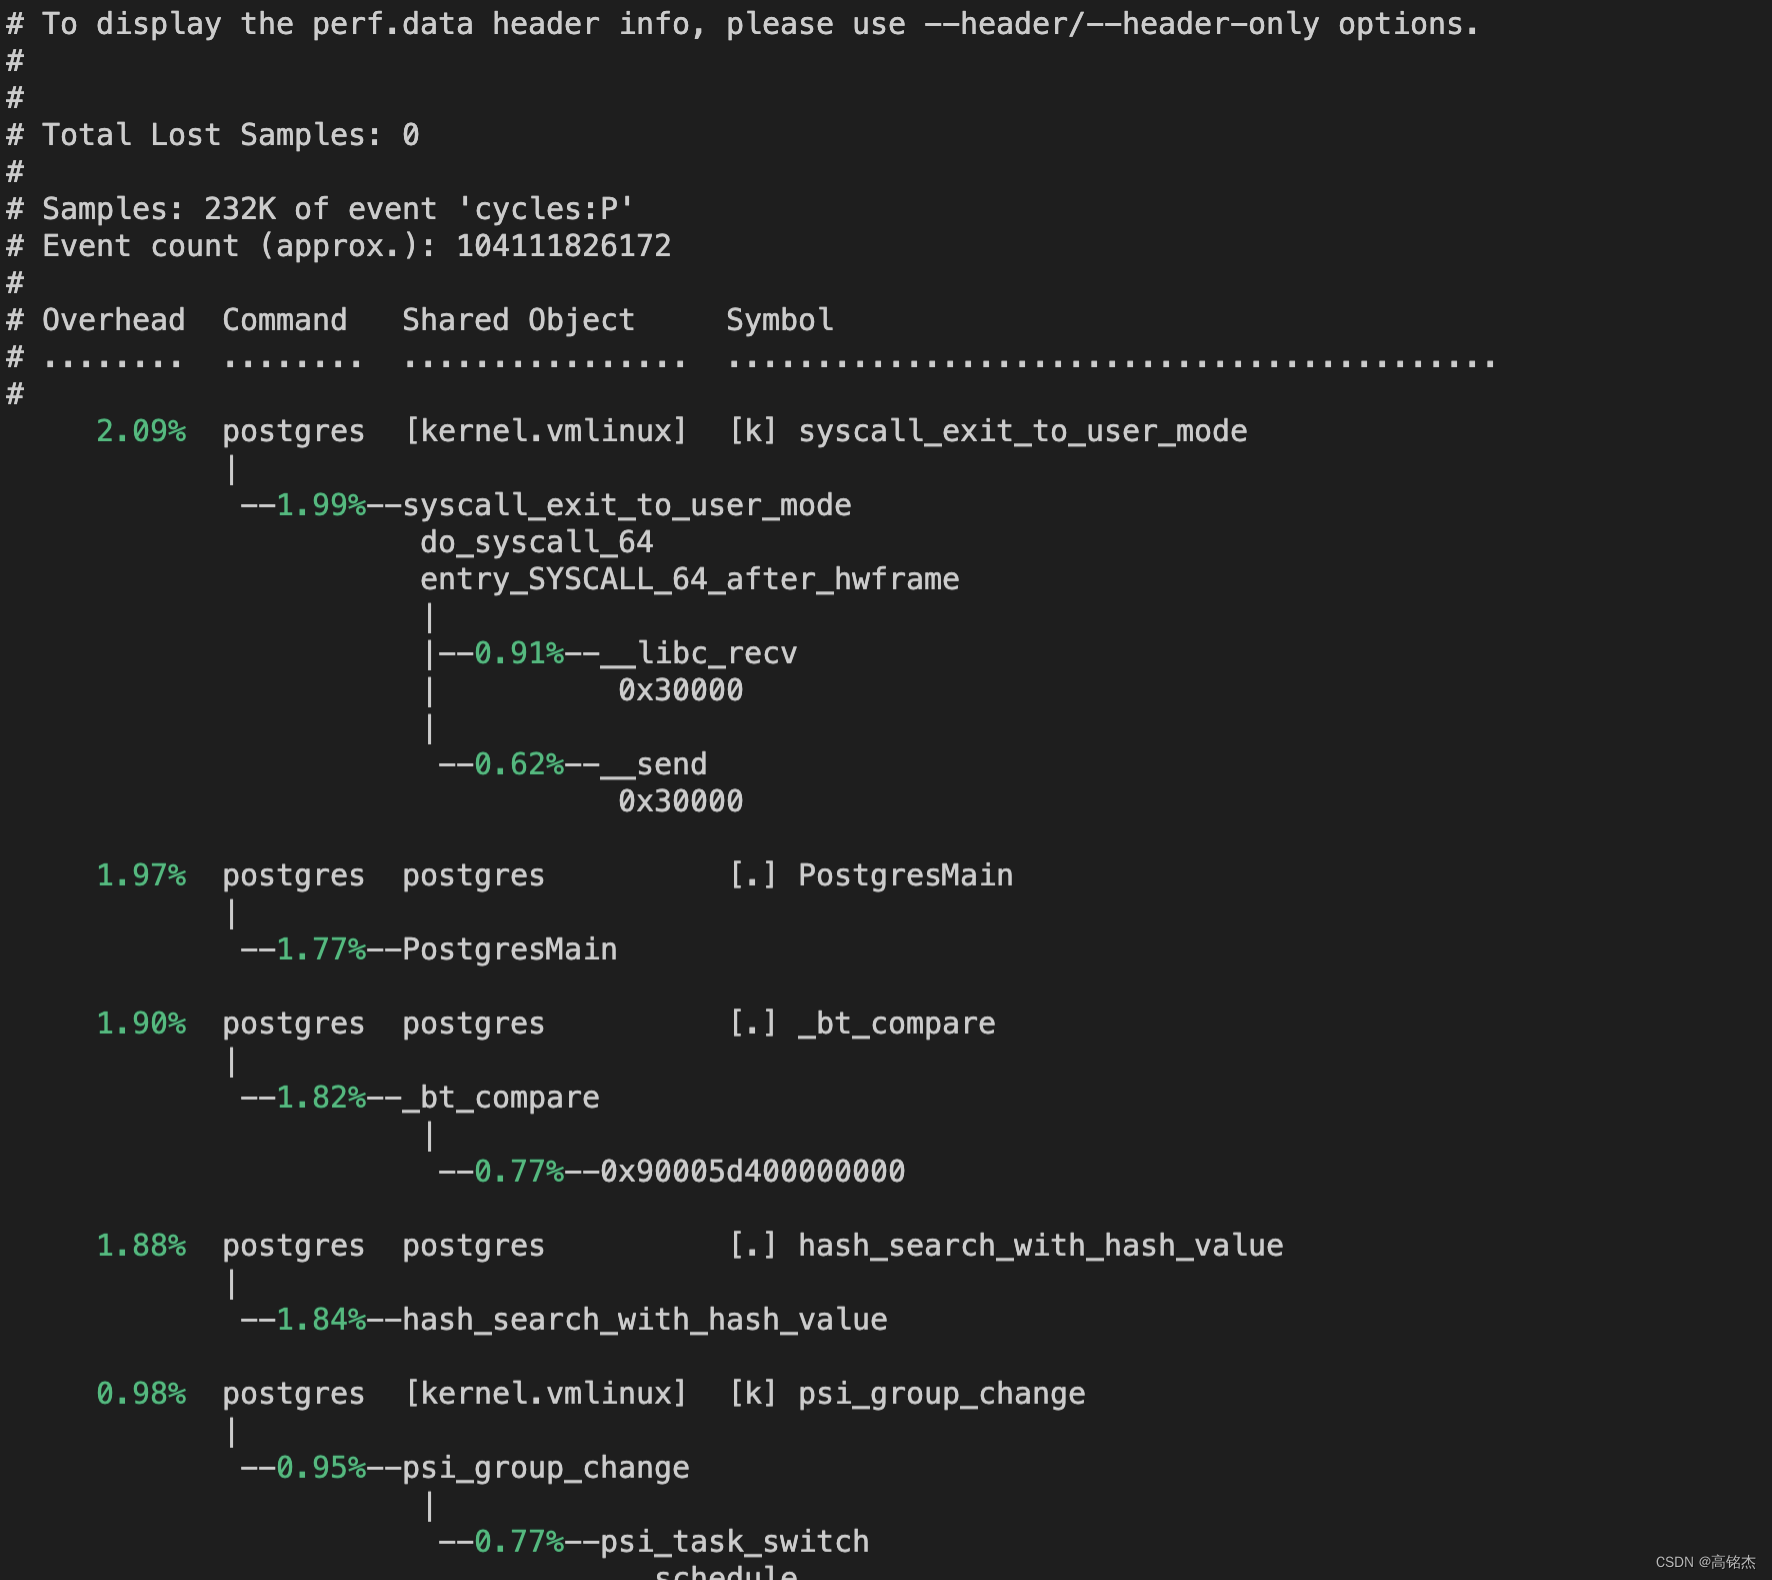
- 按SELF排序展开:
perf report --no-children --stdio
5 PERF STAT
注意vm上使用会有限制,在物理机上测试。
5.1 场景一:关注CPU使用情况perf stat -d
准备数据:
drop table t1;
create table t1(c1 serial8 primary key, c2 text, c3 timestamp);
开始测试:
perf stat -d -- /usr/bin/psql -h127.0.0.1 -U postgres -p 9999 postgres -c "insert into t1 select i, md5(random()::text), now() from generate_series(1, 1000000) t(i)";
INSERT 0 1000000

 Performance counter stats for '/usr/bin/psql -h127.0.0.1 -U postgres -p 9999 postgres -c insert into t1 select i, md5(random()::text), now() from generate_series(1, 1000000) t(i)':

              6.49 msec task-clock                       #    0.002 CPUs utilized
                 3      context-switches                 #  462.220 /sec
                 0      cpu-migrations                   #    0.000 /sec
               474      page-faults                      #   73.031 K/sec
        16,389,325      cycles                           #    2.525 GHz                         (38.37%)
        14,418,870      instructions                     #    0.88  insn per cycle              (53.78%)
         3,040,699      branches                         #  468.490 M/sec                       (53.77%)
            99,270      branch-misses                    #    3.26% of all branches             (53.69%)
             8,688      L1-dcache-loads                  #  697.749 M/sec                       (30.82%)
           272,823      L1-dcache-load-misses            #    6.02% of all L1-dcache accesses   (30.82%)
            95,365      LLC-loads                        #   14.693 M/sec                       (30.89%)
            28,676      LLC-load-misses                  #   30.07% of all L1-icache accesses   (30.89%)

       4.111546535 seconds time elapsed

       0.003017000 seconds user
       0.003656000 seconds sys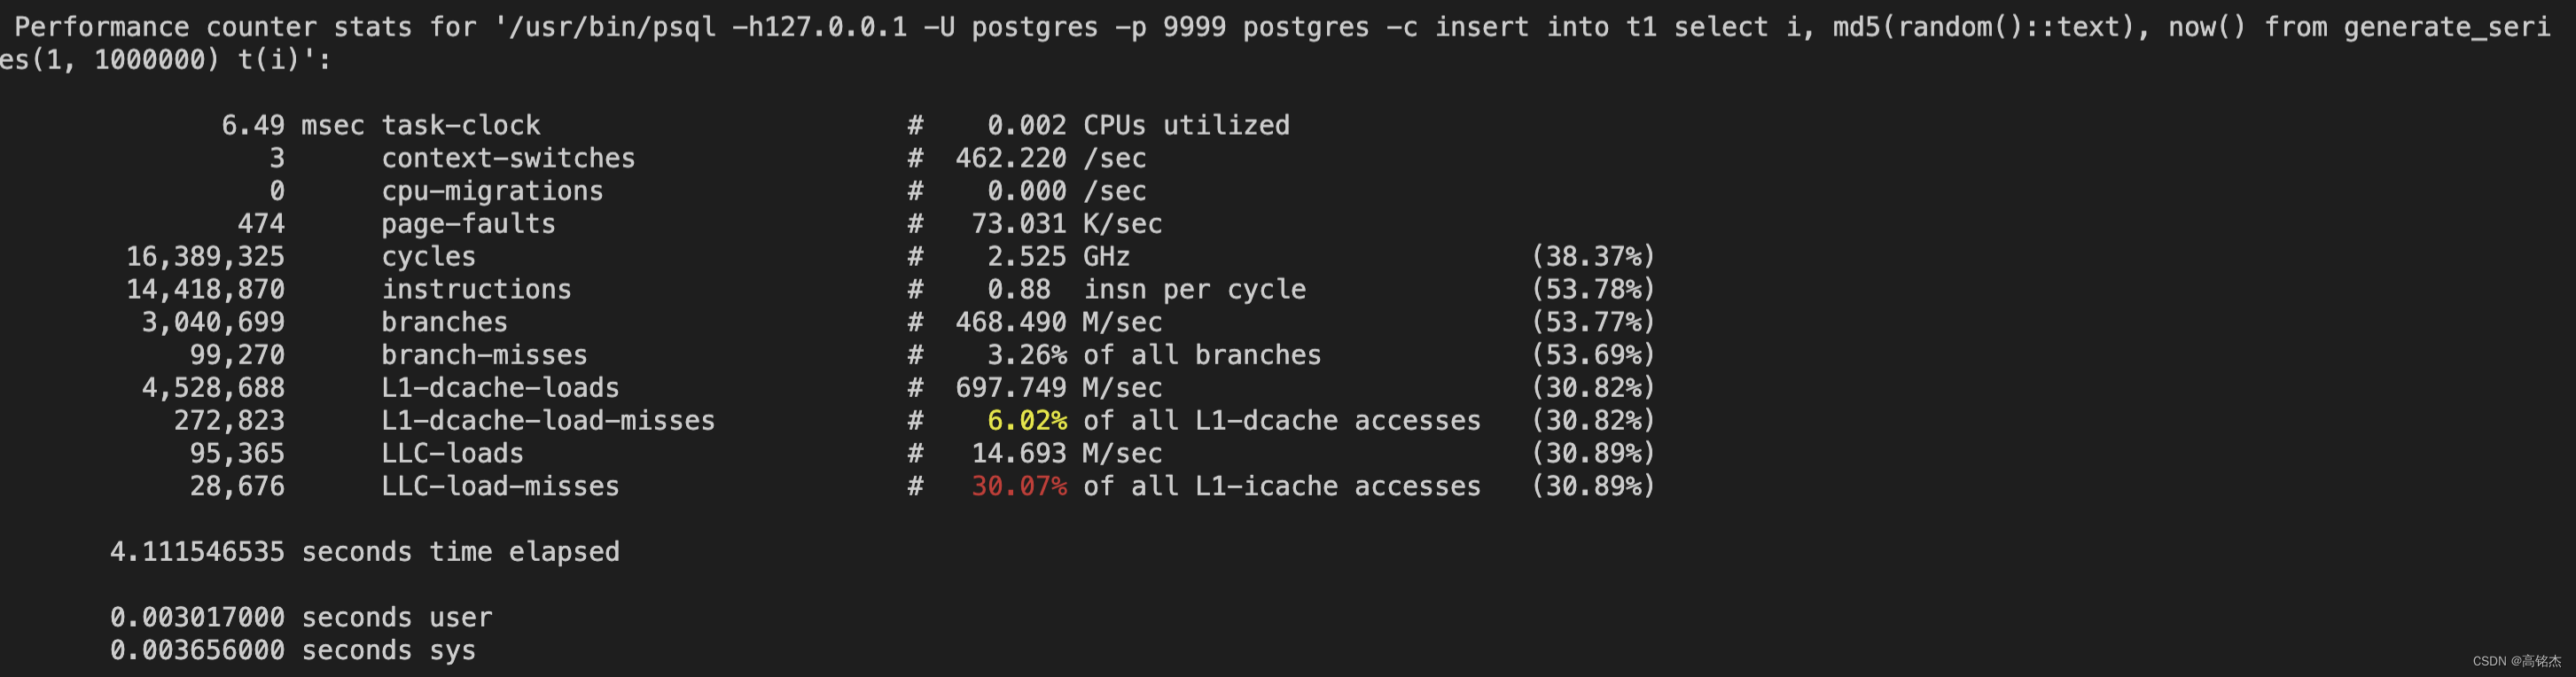
5.2 场景二:关注L1使用情况perf stat -e
#  perf list | grep L1-dcache
  L1-dcache-loads OR cpu/L1-dcache-loads/
  L1-dcache-load-misses OR cpu/L1-dcache-load-misses/
  L1-dcache-stores OR cpu/L1-dcache-stores/

perf stat -e L1-dcache-loads,L1-dcache-load-misses,L1-dcache-stores -- /usr/bin/psql -h127.0.0.1 -U postgres -p 9999 postgres -c "insert into t1 select i, md5(random()::text), now() from generate_series(1, 1000000) t(i)";
结果
 Performance counter stats for '/usr/bin/psql -h127.0.0.1 -U postgres -p 9999 postgres -c insert into t1 select i, md5(random()::text), now() from generate_series(1, 1000000) t(i)':

         4,977,428      L1-dcache-loads                                                         (60.90%)
           231,942      L1-dcache-load-misses            #    4.66% of all L1-dcache accesses   (66.04%)
         1,978,389      L1-dcache-stores                                                        (73.06%)

       3.889877294 seconds time elapsed

       0.003390000 seconds user
       0.003122000 seconds sys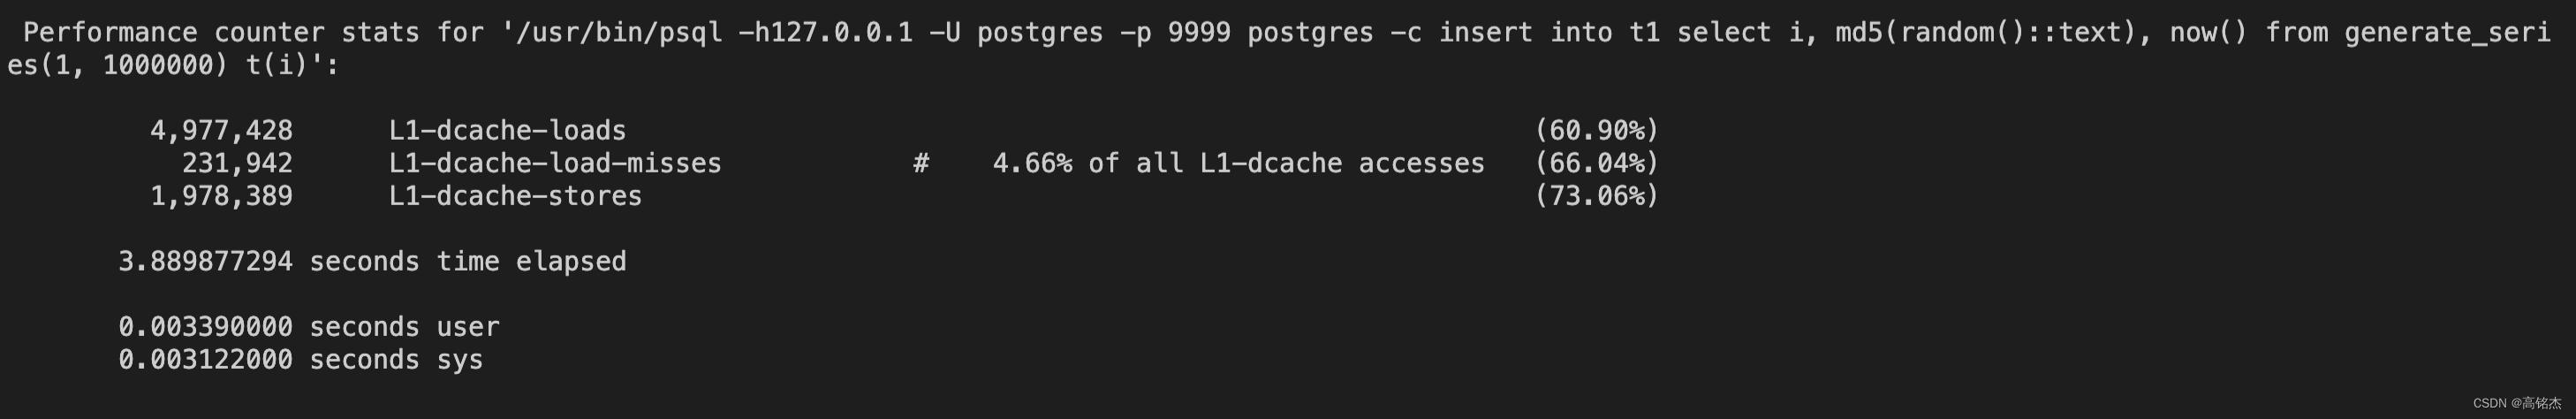
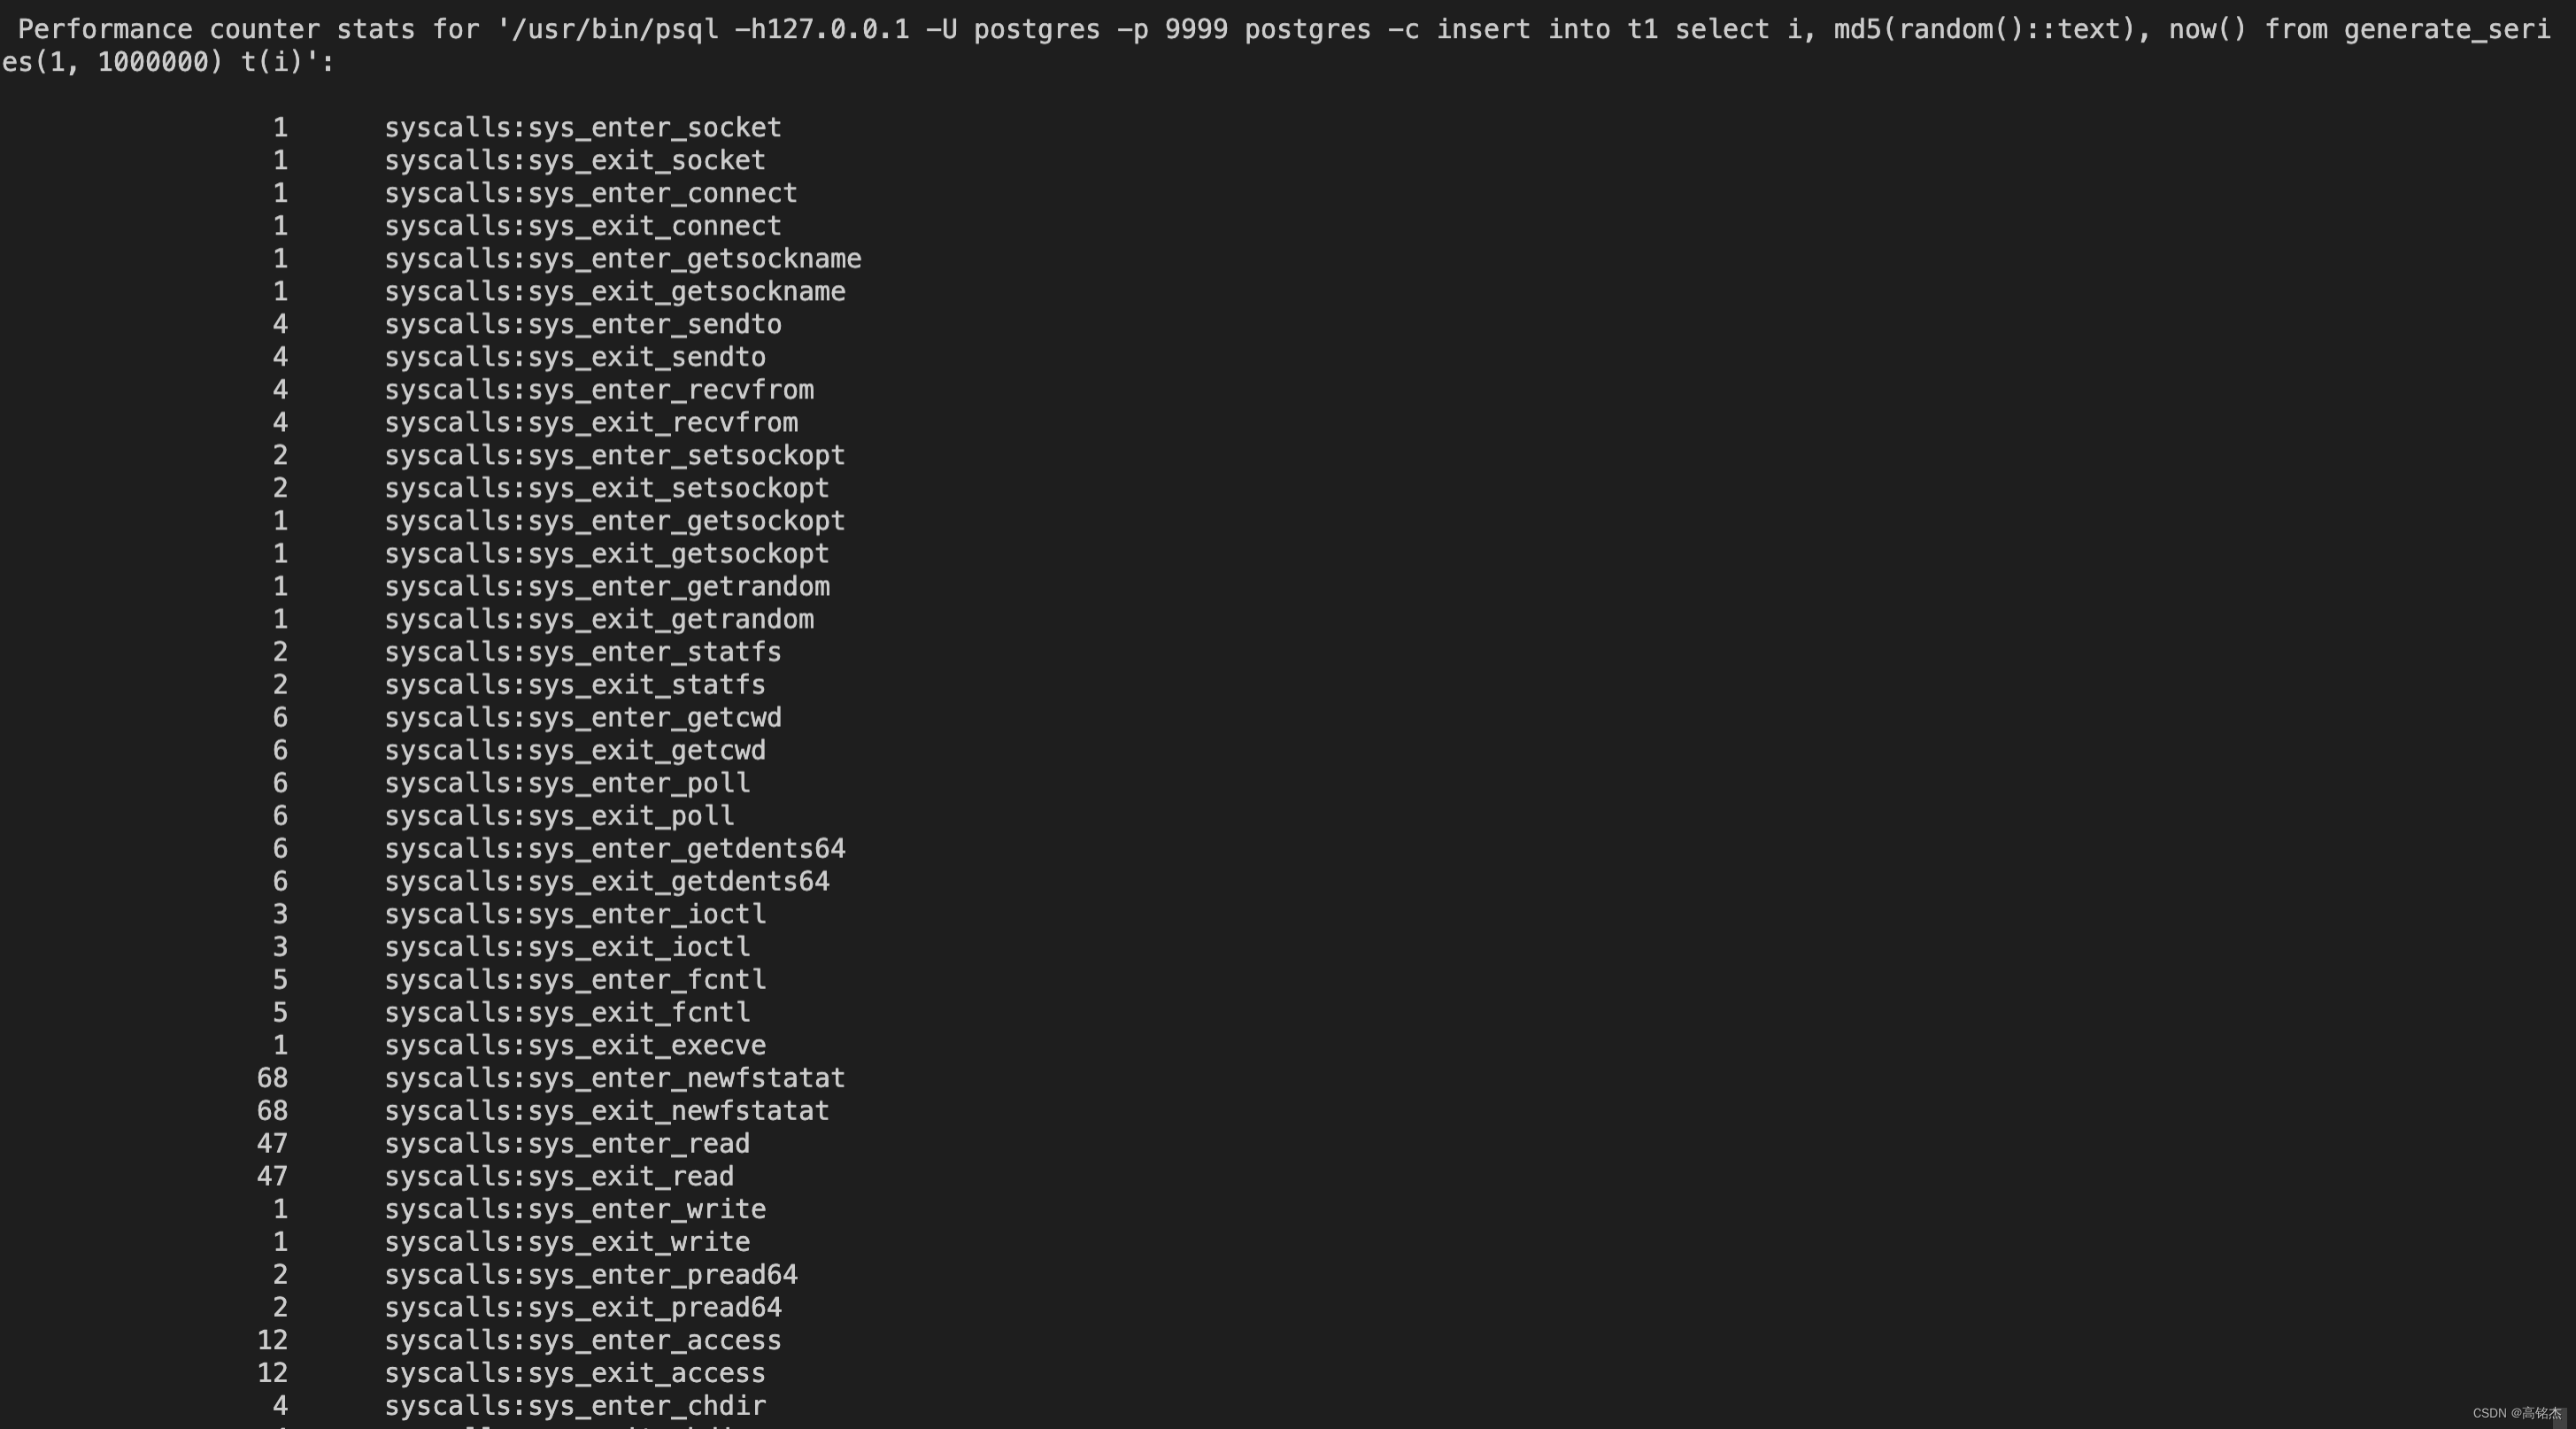
5.3 场景三:关注内核调用perf stat -e
注意怎么过滤等于0的事件,否则打印太多。
perf stat -e 'syscalls:*,block:*' -- /usr/bin/psql -h127.0.0.1 -U postgres -p 9999 postgres -c "insert into t1 select i, md5(random()::text), now() from generate_series(1, 1000000) t(i)" 2>&1 | awk '$1 != 0'