手把手教你用Python和OpenCV搭建一个半自动标注工具(详细步骤 + 源码)
手把手教你用Python和OpenCV搭建一个半自动标注工具(详细步骤 + 源码)

背景介绍
样本标注是深度学习项目中最关键的部分,甚至在模型学习效果上起决定性作用。但是,标注工作往往非常繁琐且耗时。一种解决方案是使用自动图像标注工具,它可以大大减少标注的时间。
本文主要介绍的半自动标注工具为pyOpenAnnotate,此工具是基于Python和OpenCV实现,最新版本为0.4.0,可通过下面指令安装使用:
pip install pyOpenAnnotate详细介绍与使用步骤参考链接:
https://pypi.org/project/pyOpenAnnotate/
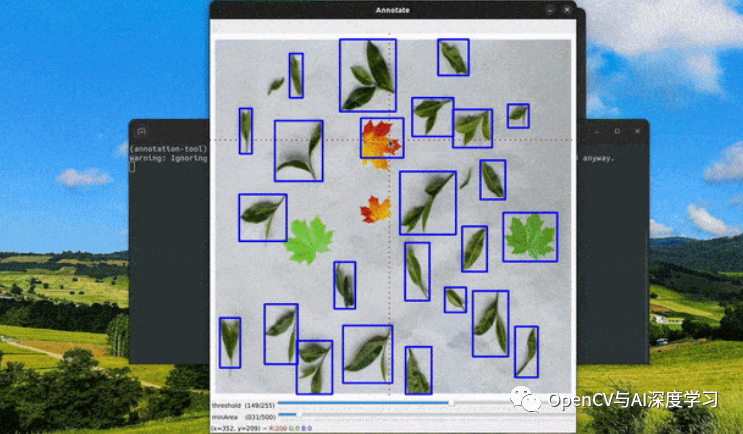
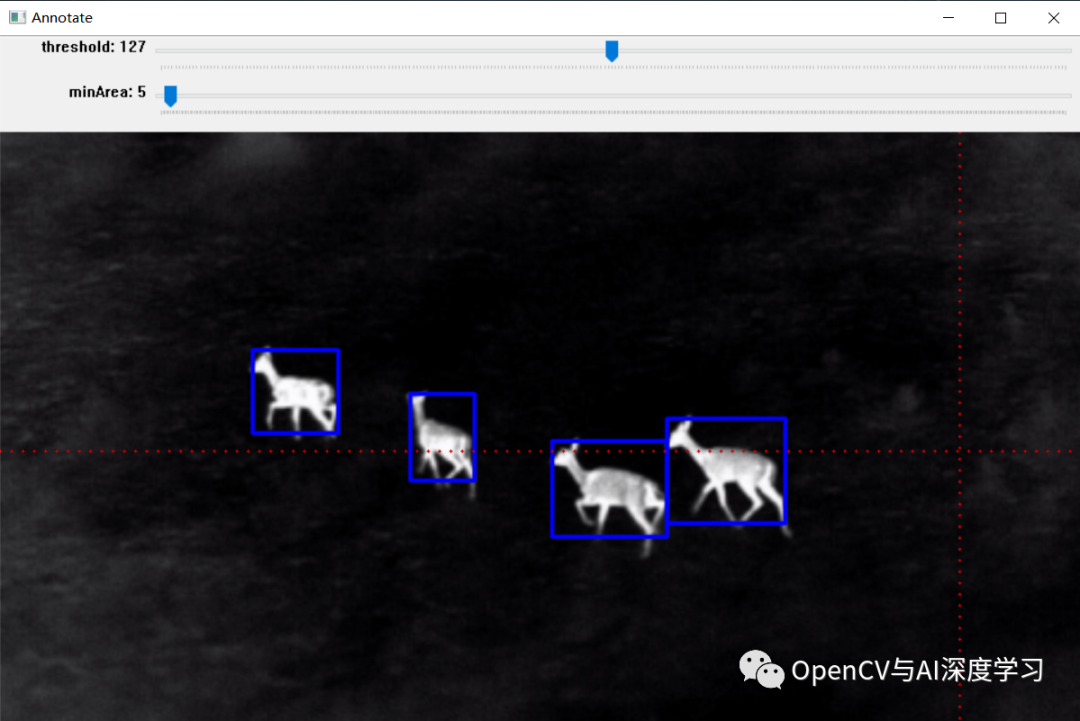
标注效果:


效果如上图所示,标注完成后可以生成标注文件,后面部分将详细介绍其实现步骤。
实现步骤
实现原理流程:
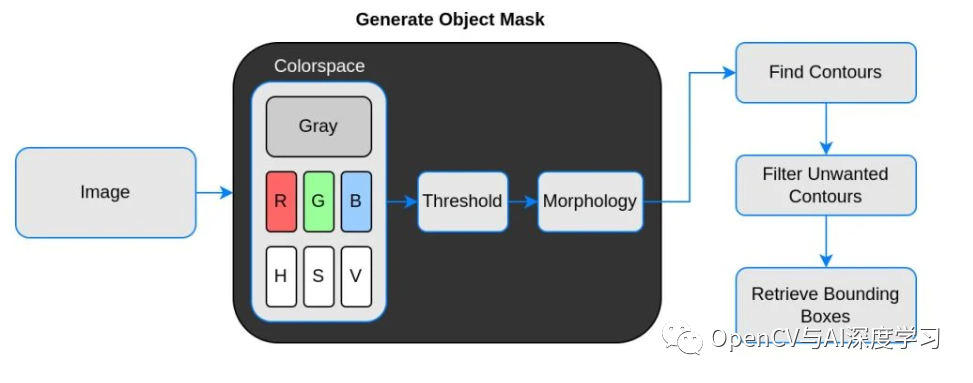
说明:
【1】Threshold(二值化)只接受单通道图像,但这里并不是直接使用灰度转换图来处理,而是从灰度图、R、G、B、H、S、V通道图像中找到对比度最高的图像来做二值化。
【2】二值化之后并不能保证总是得到我们需要的掩码,有时会有噪声、斑点、边缘的干扰,所以加入了膨胀、腐蚀等形态学处理。
【3】最后通过轮廓分析得到对象的边界框,也就是左上角和右下角坐标。
代码讲解与演示
首先需要导入所需库:
import cv2
import numpy as np
import matplotlib.pyplot as plt
plt.rcParams['image.cmap'] = 'gray'
加载图像:
stags = cv2.imread('stags.jpg')
boars = cv2.imread('boar.jpg')
berries = cv2.imread('strawberries.jpg')
fishes = cv2.imread('fishes.jpg')
coins = cv2.imread('coins.png')
boxes = cv2.imread('boxes2.jpg')
选择色彩空间(这里添加了 RGB和HSV,存储在字典中,方便验证使用):
def select_colorsp(img, colorsp='gray'):
    # Convert to grayscale.
    gray = cv2.cvtColor(img, cv2.COLOR_BGR2GRAY)
    # Split BGR.
    red, green, blue = cv2.split(img)
    # Convert to HSV.
    im_hsv = cv2.cvtColor(img, cv2.COLOR_BGR2HSV)
    # Split HSV.
    hue, sat, val = cv2.split(im_hsv)
    # Store channels in a dict.
    channels = {'gray':gray, 'red':red, 'green':green,
                'blue':blue, 'hue':hue, 'sat':sat, 'val':val}

    return channels[colorsp]
显示 1×2 图像的实用函数(display()函数接受两个图像并并排绘制。可选参数是绘图的标题和图形大小):
def display(im_left, im_right, name_l='Left', name_r='Right', figsize=(10,7)):

    # Flip channels for display if RGB as matplotlib requires RGB.
    im_l_dis = im_left[...,::-1]  if len(im_left.shape) > 2 else im_left
    im_r_dis = im_right[...,::-1] if len(im_right.shape) > 2 else im_right

    plt.figure(figsize=figsize)
    plt.subplot(121); plt.imshow(im_l_dis);
    plt.title(name_l); plt.axis(False);
    plt.subplot(122); plt.imshow(im_r_dis);
    plt.title(name_r); plt.axis(False);
阈值处理(thresh()函数接受1通道灰度图像,默认阈值设置为 127。执行逆阈值处理,方便轮廓分析,它返回单通道阈值图像):
def threshold(img, thresh=127, mode='inverse'):
    im = img.copy()

    if mode == 'direct':
        thresh_mode = cv2.THRESH_BINARY
    else:
        thresh_mode = cv2.THRESH_BINARY_INV

    ret, thresh = cv2.threshold(im, thresh, 255, thresh_mode)

    return thresh
实例:雄鹿红外图像标注
整体实现步骤:
【1】选择色彩空间
# Select colorspace.
gray_stags = select_colorsp(stags)
# Perform thresholding.
thresh_stags = threshold(gray_stags, thresh=110)


# Display.
display(stags, thresh_stags,
        name_l='Stags original infrared',
        name_r='Thresholded Stags',
        figsize=(20,14))
【2】执行阈值

【3】执行形态学操作
def morph_op(img, mode='open', ksize=5, iterations=1):
    im = img.copy()
    kernel = cv2.getStructuringElement(cv2.MORPH_ELLIPSE,(ksize, ksize))

    if mode == 'open':
        morphed = cv2.morphologyEx(im, cv2.MORPH_OPEN, kernel)
    elif mode == 'close':
        morphed = cv2.morphologyEx(im, cv2.MORPH_CLOSE, kernel)
    elif mode == 'erode':
        morphed = cv2.erode(im, kernel)
    else:
        morphed = cv2.dilate(im, kernel)

return morphed# Perform morphological operation.
morphed_stags = morph_op(thresh_stags)
# Display.
display(thresh_stags, morphed_stags,
name_l='Thresholded Stags',
name_r='Morphological Operations Result',
figsize=(20,14))
【4】轮廓分析以找到边界框
bboxes = get_bboxes(morphed_stags)
ann_morphed_stags = draw_annotations(stags, bboxes, thickness=5, color=(0,0,255))

# Display.
display(ann_stags, ann_morphed_stags,
        name_l='Annotating Thresholded Stags',
        name_r='Annotating Morphed Stags',
        figsize=(20,14))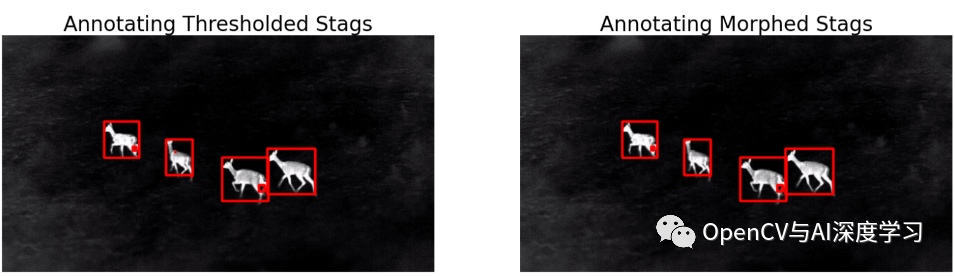
【5】过滤不需要的轮廓
def get_filtered_bboxes(img, min_area_ratio=0.001):
    contours, hierarchy = cv2.findContours(img, cv2.RETR_LIST, cv2.CHAIN_APPROX_SIMPLE)
    # Sort the contours according to area, larger to smaller.
    sorted_cnt = sorted(contours, key=cv2.contourArea, reverse = True)
    # Remove max area, outermost contour.
    sorted_cnt.remove(sorted_cnt[0])
    # Container to store filtered bboxes.
    bboxes = []
    # Image area.
    im_area = img.shape[0] * img.shape[1]
    for cnt in sorted_cnt:
        x,y,w,h = cv2.boundingRect(cnt)
        cnt_area = w * h
        # Remove very small detections.
        if cnt_area > min_area_ratio * im_area:
            bboxes.append((x, y, x+w, y+h))
    return bboxes
【6】绘制边界框
bboxes = get_filtered_bboxes(thresh_stags, min_area_ratio=0.001)
filtered_ann_stags = draw_annotations(stags, bboxes, thickness=5, color=(0,0,255))

# Display.
display(ann_stags, filtered_ann_stags,
        name_l='Annotating Thresholded Stags',
        name_r='Annotation After Filtering Smaller Boxes',
        figsize=(20,14))
视频标注:
【7】以需要的格式保存
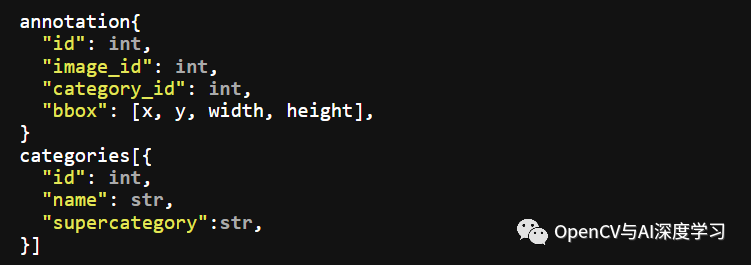
Pascal VOC、YOLO和COCO 是对象检测中使用的三种流行注释格式。让我们研究一下它们的结构。
I. Pascal VOC 以 XML 格式存储注释

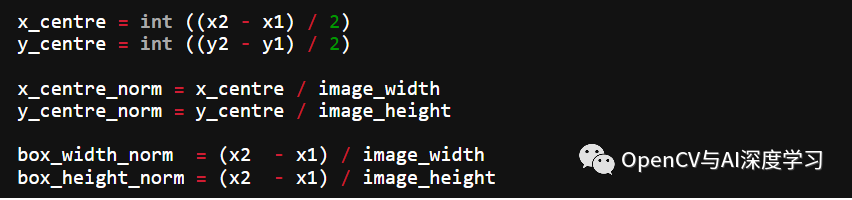
II. YOLO标注结果保存在文本文件中。对于每个边界框,它看起来如下所示。这些值相对于图像的高度和宽度进行了归一化。
0 0.0123 0.2345 0.123 0.754<object-class> <x_centre_norm> <y_centre_norm> <box_width_norm> <box_height_norm>让边界框的左上角和右下角坐标表示为(x1, y1)和(x2, y2)。然后:
III. MS COCO
这里以YOLO Darknet保存格式为例(当然,你可以保存其他格式):
def save_annotations(img, bboxes):
    img_height = img.shape[0]
    img_width = img.shape[1]
    with open('image.txt', 'w') as f:
        for box in boxes:
            x1, y1 = box[0], box[1]
            x2, y2 = box[2], box[3]

            if x1 > x2:
                x1, x2 = x2, x1
            if y1 > y2:
                y1, y2 = y2, y1

            width = x2 - x1
            height = y2 - y1
            x_centre, y_centre = int(width/2), int(height/2)

            norm_xc = x_centre/img_width
            norm_yc = y_centre/img_height
            norm_width = width/img_width
            norm_height = height/img_height

            yolo_annotations = ['0', ' ' + str(norm_xc),
                                ' ' + str(norm_yc),
                                ' ' + str(norm_width),
                                ' ' + str(norm_height), '\n']

            f.writelines(yolo_annotations)
标注结果显示与保存:

简单演示:
?
本文分享自 OpenCV与AI深度学习 微信公众号,前往查看
如有侵权,请联系 cloudcommunity@tencent.com 删除。
本文参与?腾讯云自媒体分享计划? ,欢迎热爱写作的你一起参与!