空间转录组数据分析之niche“环”(ring)
原创空间转录组数据分析之niche“环”(ring)
原创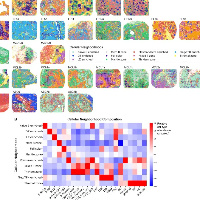
追风少年i
发布于 2024-04-05 20:27:07
发布于 2024-04-05 20:27:07
作者,Evil Genius
不知道大家发现了没有,自然界对圆情有独钟,三维上就是球,从原子到地球、太阳,都离不开圆和球。

即使放在我们空间转录组而言,最开始的Visium也是圆形的,虽然最新的HD是方形的,但是如果我们考虑其生态位分析,依然是环。

对于我们的环,一般的定义如下:
- immediate (1-Ring) or extended neighborhood (3-Rings) of a spot。
如果大家认真看过之前的文章,也分享过环,不过是R版本
今天我们要更新我们python版本的niche环,环的数量可以自己定义。
我们希望拿到如下的结果

import scanpy as sc
import squidpy as sq
import numpy as np
import pandas as pd
import os
import sys
import seaborn as sb
import matplotlib.pyplot as plt
from matplotlib import colors

#import scvi
import anndata as ad

import warnings
warnings.filterwarnings("ignore")

from collections import Counter

import ipywidgets as widgets
from ipywidgets import interact, interact_manual

plt.rcParams['figure.figsize'] = (6, 6)

from IPython.core.display import display, HTML
import random

#Define a colour map for gene expression
colors2 = plt.cm.Reds(np.linspace(0, 1, 128))
colors3 = plt.cm.Greys_r(np.linspace(0.7,0.8,20))
#colorsComb = np.vstack([colors3, colors2])
#mymap = colors.LinearSegmentedColormap.from_list('my_colormap', colorsComb)
from matplotlib import colors
colorsComb = np.vstack([plt.cm.Reds(np.linspace(0, 1, 128)), plt.cm.Greys_r(np.linspace(0.7, 0.8, 0))])
mymap = colors.LinearSegmentedColormap.from_list('my_colormap', colorsComb)

# Helper function to split list in chunks
def chunks(lista, n):
    for i in range(0, len(lista), n):
        yield lista[i:i + n]

        plt.rcParams['figure.figsize'] = (6, 5)
sc.set_figure_params(dpi=100, vector_friendly=True)
def mysize(w, h, d):
    fig, ax = plt.subplots(figsize = (w, h), dpi = d)
    return(fig.gca())
plt.rcParams['figure.figsize'] = (6, 5)
sc.set_figure_params(dpi=100, vector_friendly=True)

import scvi

## frequently used variables
from matplotlib import colors
import matplotlib.pyplot as plt
colorsComb = np.vstack([plt.cm.Reds(np.linspace(0, 1, 128)), plt.cm.Greys_r(np.linspace(0.7, 0.8, 0))])
mymap = colors.LinearSegmentedColormap.from_list('my_colormap', colorsComb)

## Along these Lines, a colourmap diverging from gray to red
gray_red = colors.LinearSegmentedColormap.from_list("grouping", ["lightgray", "red", "darkred"], N = 128)

## Some more Colour Maps
gray_violet = colors.LinearSegmentedColormap.from_list("grouping", ["lightgray", "mediumvioletred", "indigo"], N = 128)
gray_blue = colors.LinearSegmentedColormap.from_list("grouping", ["lightgray", "cornflowerblue", "darkblue"], N = 128)


def mysize(w, h, d):
    fig, ax = plt.subplots(figsize = (w, h), dpi = d)
    return(fig.gca())
#plt.rcParams['figure.figsize'] = (6, 5)
#sc.set_figure_params(dpi=120, vector_friendly=True)
import matplotlib.colors as colors
c_low = colors.colorConverter.to_rgba('orange', alpha = 0)
c_high = colors.colorConverter.to_rgba('red',alpha = 1)
cmap_transparent = colors.LinearSegmentedColormap.from_list('rb_cmap',[c_low, c_high], 512)
import matplotlib.colors as colors
c_low2 = colors.colorConverter.to_rgba('green', alpha = 0)
c_high2 = colors.colorConverter.to_rgba('darkblue',alpha = 1)
cmap_transparent2 = colors.LinearSegmentedColormap.from_list('rb_cmap',[c_low2, c_high2], 512)

import cell2location as c2l
from cell2location.utils import select_slide
加载我们的数据,注意要完成空间的细胞注释
##load
adata_vis = sc.read(f".h5ad")

Niche_NMF_palette = dict(zip(adata_vis.obs.Niche_NMF.cat.categories, adata_vis.uns["Niche_NMF_colors"]))
####细胞类型
cts = ['AT0', 'AT1', 'AT2', 'Aberrant basaloid', 'Adventitial fibroblast', 'Alveolar fibroblast',
       'Artery', 'B/Plasma', 'Basal', 'Basophil/Mast', 'Bronchial Vessel', 'Capillary', 'Capillary Aerocyte',
       'Ciliated', 'Ciliated SFTPB+/SCGB1A1+', 'Dendritic', 'Ionocyte', 'Lymphatic', 'Macrophage C1Q hi',
       'Macrophage CHI3L1+/CD9 hi/', 'Macrophage FABP4+', 'Macrophage IL1B+', 'Macrophage LYVE1+',
       'Macrophage RETN+/VCAN+', 'Mesothelial', 'Monocyte', 'Mucous', 'Myofibroblast', 'NK',
       'Peribronchial fibroblast', 'Pericyte', 'Smooth Muscle', 'T cell', 'TB-SC', 'Vein', 'pDC', 'preTB-SC/RAS']
选取单个样本
IPF = adata_vis[adata_vis.obs["treatment"].isin(["IPF"])]
sq.gr.spatial_neighbors(IPF, coord_type="grid", spatial_key="spatial",library_key="sampleID",n_rings=1)
sq.gr.nhood_enrichment(IPF, cluster_key="Niche_NMF")

sq.pl.nhood_enrichment(IPF, cluster_key="Niche_NMF", method="ward", cmap="bwr",vmax=90, vmin=-90, figsize=(5,5),title="1-Ring", save="IPF_nhood_enrichment_zscore_1_ring.pdf")#mode="zscore")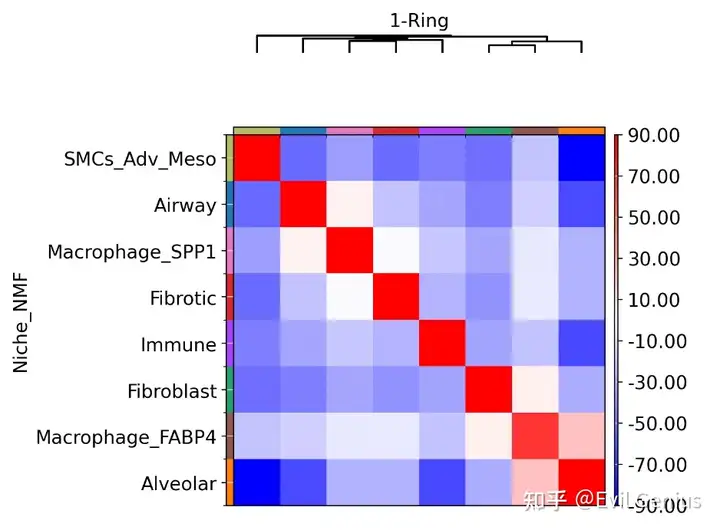
环1的数据
niche_IPF_1_ring = pd.DataFrame(IPF.uns["Niche_NMF_nhood_enrichment"]["count"], index=IPF.obs['Niche_NMF'].cat.categories, columns = IPF.obs['Niche_NMF'].cat.categories)
niche_IPF_1_ring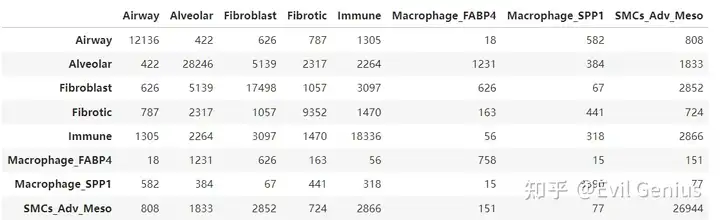
sb.reset_defaults()
sb.heatmap(niche_IPF_1_ring, annot=False, cmap=mymap, )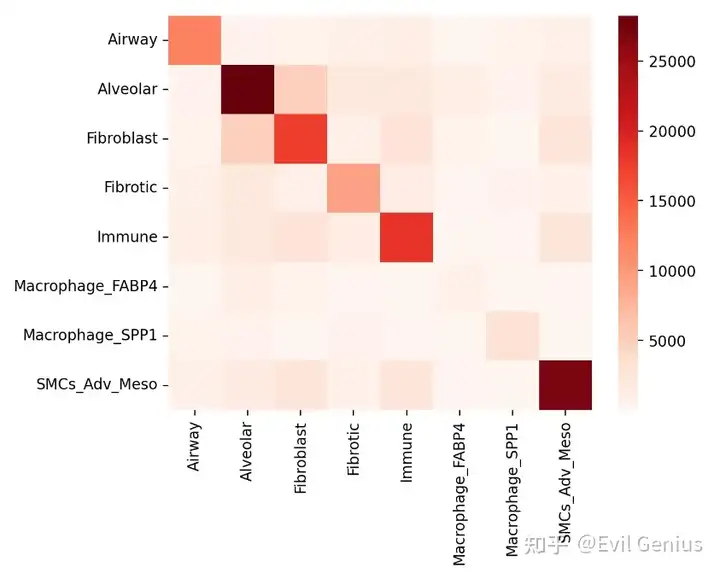
niche_IPF_1_ring = niche_IPF_1_ring.div(niche_IPF_1_ring.sum(axis=1), axis=0)
niche_IPF_1_ring
sb.heatmap(niche_IPF_1_ring, annot=True, cmap=mymap, fmt=".2f" )
plt.savefig("./figures/PercentageOfInteractions_IPF_1_Ring.pdf")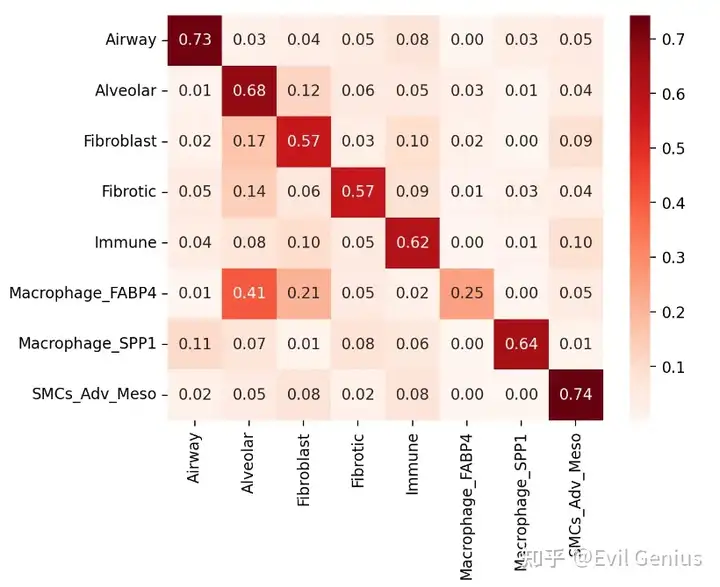
分析我们的三环
sq.gr.spatial_neighbors(IPF, coord_type="grid", spatial_key="spatial",library_key="sampleID",n_rings=3)
sq.gr.nhood_enrichment(IPF, cluster_key="Niche_NMF")
sq.pl.nhood_enrichment(IPF, cluster_key="Niche_NMF", method="ward", cmap="bwr",vmax=90, vmin=-90,  figsize=(5,5),title="3-Ring", save="IPF_nhood_enrichment_zscore_3_ring.pdf")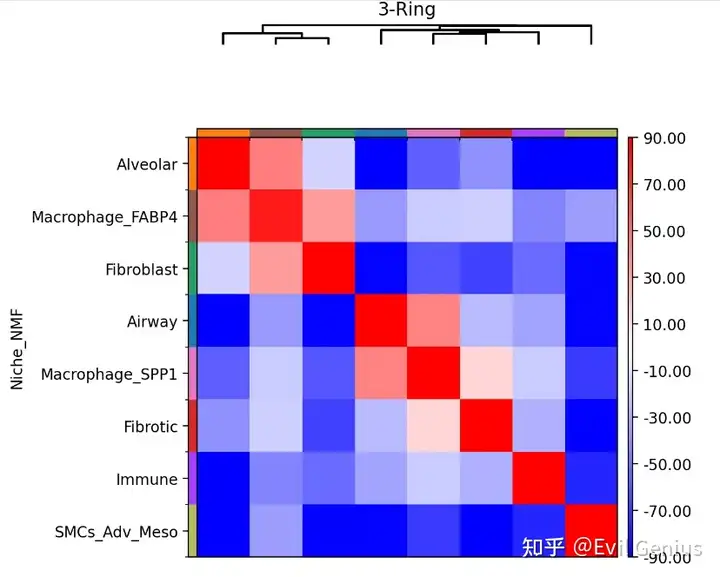
niche_IPF_3_ring = pd.DataFrame(IPF.uns["Niche_NMF_nhood_enrichment"]["count"], index=IPF.obs['Niche_NMF'].cat.categories, columns = IPF.obs['Niche_NMF'].cat.categories)
niche_IPF_3_ring
sb.reset_defaults()
sb.heatmap(niche_IPF_3_ring, annot=False, cmap=mymap, )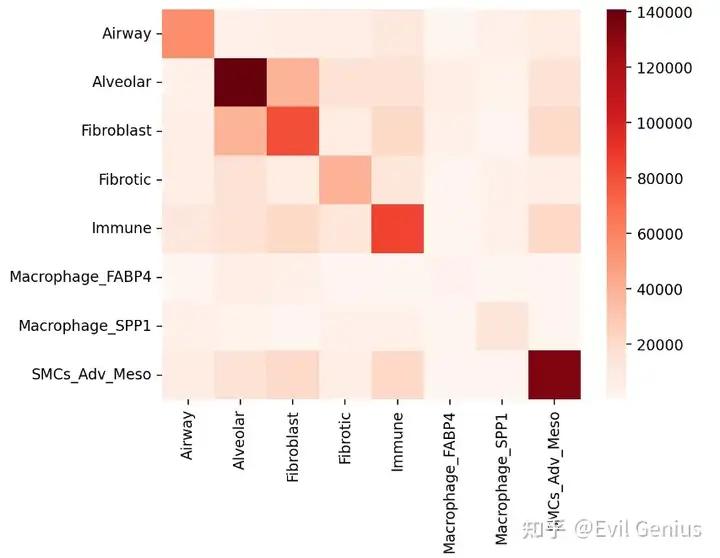
niche_IPF_3_ring = niche_IPF_3_ring.div(niche_IPF_3_ring.sum(axis=1), axis=0)
niche_IPF_3_ring
sb.heatmap(niche_IPF_3_ring, annot=True, cmap=mymap, fmt=".2f" )
plt.savefig("./figures/PercentageOfInteractions_IPF_3_Ring.pdf")
生活很好,有你更好
原创声明:本文系作者授权腾讯云开发者社区发表,未经许可,不得转载。
如有侵权,请联系 cloudcommunity@tencent.com 删除。
原创声明:本文系作者授权腾讯云开发者社区发表,未经许可,不得转载。
如有侵权,请联系 cloudcommunity@tencent.com 删除。
评论
登录后参与评论
推荐阅读
目录