单细胞、空间、外显子分析方法更新
原创单细胞、空间、外显子分析方法更新
原创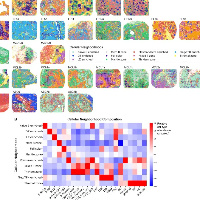
作者,Evil Genius
这一篇更新一下单细胞空间做轨迹分析的monocle2的认知以及call snp
多组学的时代你说来了吧,也只有大课题组在做,发的文章都是CNS级别,你说没来吧,做的人又非常少,可以做单细胞 + 空间的都不算很多,再加上VDJ 、 外显子、宏基因组等,就更少了,矛盾的背后其实是科技力量的竞争。
参考文章依然是An atlas of epithelial cell states and plasticity in lung adenocarcinoma,2024年2月发表于nature(IF 64.8)。
第一点,关于轨迹基因的选择
以前做monocle2的时候官方推荐是前1000个高变基因,为了符合Seurat的结果,后来又推荐Seurat计算出来的高变基因,但是基因数量还是上千的,这个时候其实一直感觉有问题的,选择的基因数量太多,导致轨迹老是分不开或者直接断掉,参考的这篇文章更新了这一认知,重点的部分加粗了。
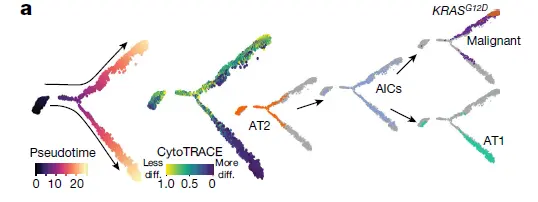
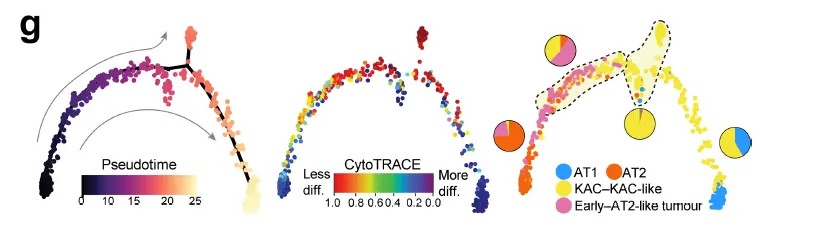
Analysis of differentiation trajectories of lung alveolar and malignant cells was performed using Monocle 2 by inferring the pseudotemporal ordering of cells according to their transcriptome similarity. Monocle 2 analysis of malignant cells from P14 was performed using default parameters with the detectGenes function. Detected genes were further required to be expressed by at least 50 cells. For construction of the differentiation trajectory of lineage-labelled epithelial cells (GFP+), the top 150 DEGs (FDR-adjusted P value < 0.05, log(fold change) > 1.5, expressed in ≥50 cells) ranked by fold-change of each cell population from NNK-treated samples were used for ordering cells with the setOrderingFilter function. Trajectories were generated using the reduceDimension function with the method set to ‘DDRTree’
作者仅采取了前150个高变基因,这个需要注意了,有分化关系的细胞类型之间渐变的过程基因通常没有颠覆式的变化,大家自己分析的时候高变基因酌情减少一点。
第二点、root的选择
以前我做轨迹分析的时候要求必须先做好细胞注释,确定好细胞类型才可以做轨迹,保证结果的准确性,这里也更新一下认知。
Trajectory roots were selected based on the following criteria:
- (1) inferred pseudotemporal gradient;
- (2) CytoTRACE score prediction
- (3) careful manual review of the DEGs along the trajectory
这个地方不用过多解释,大家应该都明白,分析的时候运用即可。
当然轨迹如果能有多组学数据的话就更加完美了。
第三点、关于空间转录组采用monocle2的情况
先来看看解读
Deconvolution showed that KACs were closer to tumour regions relative to alveolar cells. ST analysis of a KAC-enriched region showed that KACs were intermediary in the transition of alveolar parenchyma to tumour cells. Tumour regions had markedly reduced expression of NKX2-1 and the alveolar signature, a result in line with reduced alveolar differentiation in KM-LUADs。
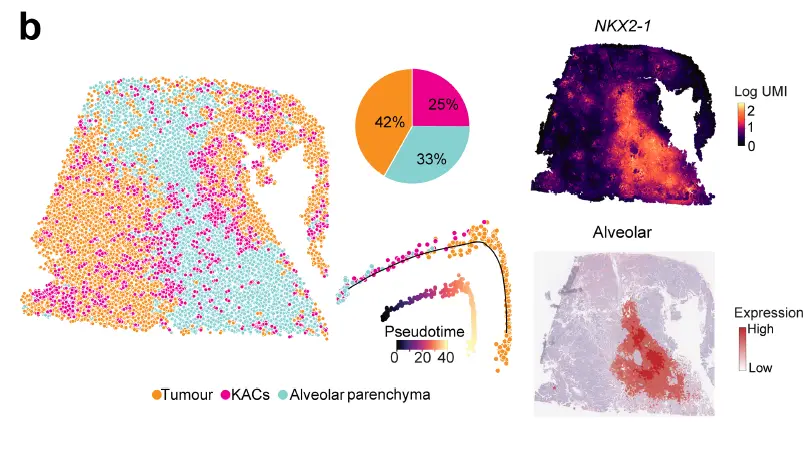
一定程度上讲空间在这种组织细胞类型扎堆分布的情况下可以做monocle2,用来判断分化的程度以及空间分布。包括下面的情况,注释的时候细胞相对扎堆分布。

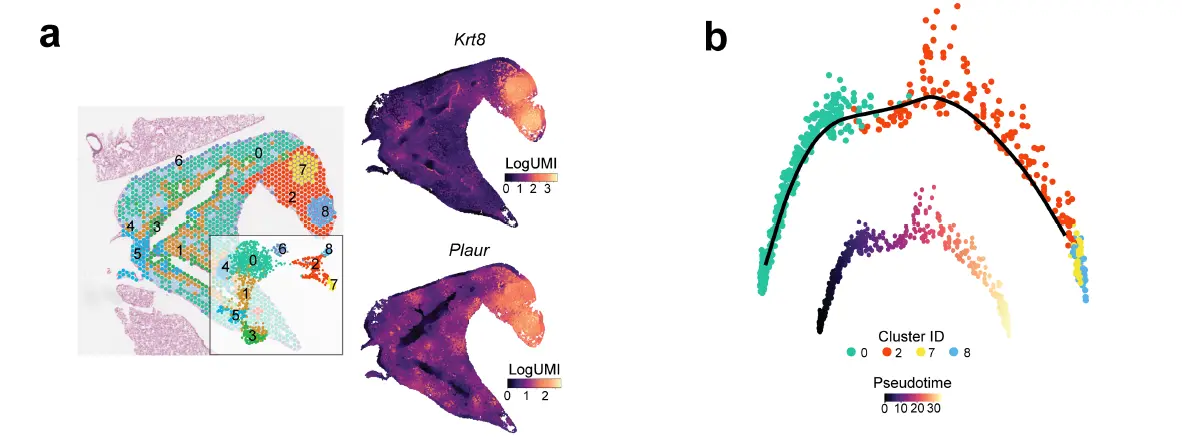
可惜的是这些结果都放在了附图里面,可见作者也知道不能作为主要的分析结果展示
第四点、识别恶性细胞的方法,融合了多组学的信息(单细胞加外显子)
- (1) Cluster distribution: owing to the high degree of inter-patient tumour heterogeneity, malignant cells often exhibit distinct cluster distribution compared with normal epithelial cells. Although non-malignant cells derived from different patients are often clustered together by cell type, malignant cells from different patients probably form separate clusters.
- (2)CNVs: we applied inferCNV to infer large-scale CNVs in each individual cell with T cells as the reference control. To quantify CNVs at the cell level, CNV scores were aggregated using a previously described strategy16. In brief, arm-level CNV scores were computed based on the mean of the squares of CNV values across each chromosomal arm. Arm-level CNV scores were further aggregated across all chromosomal arms by calculating the arithmetic mean value of the arm-level scores using the R function mean.
- (3)Marker gene expression: expression of lung epithelial lineage-specific genes and LUAD-related oncogenes was determined in epithelial cell clusters.
- (4)Cell-level expression of KRAS<sup>G12D</sup> mutations: as we previously described15, BAM files were queried for KRAS<sup>G12D</sup> mutant alleles, which were then mapped to specific cells. KRAS<sup>G12D</sup> mutations, along with cluster distribution, marker gene expression and inferred CNVs as described above, were used to distinguish malignant cells from non-malignant cells.
最后一点,突变信息匹配到单细胞级别
这个地方真的是被文章的聪明惊呆了。一开始我还不明白为什么构建5‘文库,却没有做VDJ,看了突变明白了。
Mapping KRAS codon 12 mutations. To map somatic KRAS mutations at single-cell resolution, alignment records were extracted from the corresponding BAM files using mutation location information. Unique mapping alignments (MAPQ = 255) labelled as either PCR duplication or secondary mapping were filtered out. The resulting somatic variant carrying reads were evaluated using Integrative Genomics Viewer (IGV) and the CB tags were used to identify cell identities of mutation-carrying reads. To estimate the VAF of KRAS<sup>G12D</sup> mutation and cell fraction of KRAS<sup>G12D</sup>-carrying cells within malignant and non-malignant epithelial cell subpopulations (for example, malignant cells from all LUADs, malignant cells from KM-LUADs, KACs from KM-LUADs), reads were first extracted based on their unique cell barcodes and BAM files were generated for each subpopulation using samtools. Mutations were then visualized using IGV, and VAFs were calculated by dividing the number of KRAS<sup>G12D</sup>-carrying reads by the total number of uniquely aligned reads for each subpopulation. A similar approach was used to visualize KRAS<sup>G12D</sup>-carrying reads and to calculate the VAF of KRAS<sup>G12D</sup> in KACs of normal tissues from KM-LUAD cases. To calculate the mutation-carrying cell fraction, extracted reads were mapped to the KRAS<sup>G12D</sup> locus from BAM files using AlignmentFile and fetch functions in pysam package. Extracted reads were further filtered using the ‘Duplicate’ and ‘Quality’ tags to remove PCR duplicates and low-quality mappings. The number of reads with or without KRAS<sup>G12D</sup> mutation in each cell was summarized using the CB tag in read barcodes. Mutation-carrying cell fractions were then calculated as the ratio of the number of cells with at least one KRAS<sup>G12D</sup> read over the number of cells with at least one high-quality read mapped to the locus.
生活很好,有你更好
原创声明:本文系作者授权腾讯云开发者社区发表,未经许可,不得转载。
如有侵权,请联系 cloudcommunity@tencent.com 删除。
原创声明:本文系作者授权腾讯云开发者社区发表,未经许可,不得转载。
如有侵权,请联系 cloudcommunity@tencent.com 删除。