NASA数据集——2016-2019 年期间天气研究和预报(WRF)随机时间倒拉格朗日传输(STILT)足迹数据产品
NASA数据集——2016-2019 年期间天气研究和预报(WRF)随机时间倒拉格朗日传输(STILT)足迹数据产品

ABoVE: Level-4 WRF-STILT Footprint Files for Circumpolar Receptors, 2016-2019
简介
文件修订日期:2021-12-08
数据集版本: 1
数据集摘要
本数据集提供了 2016-2019 年期间天气研究和预报(WRF)随机时间倒拉格朗日传输(STILT)足迹数据产品,这些数据产品针对位于北纬环极地区飞行路径沿线位置和各种固定观测站点的受体(观测值)。在 WRF-STILT 模型中,每架飞机和观测站位置都被视为一个独立的受体,以模拟陆地表面对观测到的大气成分的影响。足迹与化学物种无关,可应用于不同的通量模型,并纳入正式的反演框架。决定足迹场的粒子轨迹只受到 WRF 建模域外缘的限制。该数据集所包含的测量数据对于了解北极碳循环的变化以及北极永久冻土融化所带来的潜在威胁至关重要。 本数据集是《ABoVE:Level-4 WRF-STILT 粒子轨迹,2016-2019》的配套数据,可在 https://doi.org/10.3334/ORNLDAAC/1895 上查阅。
共有 304,578 个 netCDF (*.nc) 格式的数据文件,分为 32 个 TAR/GZIP 存档。还包括两个媒体(*.mp4)格式的配套文件。
数据集概述
本数据集提供了天气研究和预报(WRF)随机时间倒拉格朗日传输(STILT)足迹数据产品,用于 2016-2019 年期间位于北纬环极地区飞行路径沿线位置和各种固定观测站点的受体(观测值)。在 WRF-STILT 模型中,每个飞机和观测站位置都被视为一个独立的受体,以模拟陆地表面对观测到的大气成分的影响。足迹与化学物种无关,可应用于不同的通量模型,并纳入正式的反演框架。决定足迹场的粒子轨迹只受到 WRF 建模域外缘的限制。该数据集所包含的测量结果对于了解北极碳循环的变化以及北极永久冻土融化所带来的潜在威胁至关重要。
本数据集是《ABoVE:Level-4 WRF-STILT 粒子轨迹,2016-2019》的配套数据,可在 https://doi.org/10.3334/ORNLDAAC/1895 上查阅。
项目:北极-北方脆弱性实验
北极-北方脆弱性实验(ABoVE)是美国国家航空航天局(NASA)陆地生态计划的一项实地活动,从 2015 年开始在阿拉斯加和加拿大西部进行,为期约 10 年。ABoVE 的研究将基于实地的过程级研究与机载和卫星传感器获得的地理空间数据产品联系起来,为提高分析和建模能力奠定了基础,这些能力是了解和预测北极和北方地区生态系统对气候变化的反应及其对社会的影响所必需的。
代码
!pip install leafmap
!pip install pandas
!pip install folium
!pip install matplotlib
!pip install mapclassify

import pandas as pd
import leafmap

url = "https://github.com/opengeos/NASA-Earth-Data/raw/main/nasa_earth_data.tsv"
df = pd.read_csv(url, sep="\t")
df

leafmap.nasa_data_login()


results, gdf = leafmap.nasa_data_search(
    short_name="ABoVE_Footprints_WRF_AK_NWCa_1896",
    cloud_hosted=True,
    bounding_box=(-180.0, 30.0, 180.0, 90.0),
    temporal=("2016-07-24", "2019-12-31"),
    count=-1,  # use -1 to return all datasets
    return_gdf=True,
)


gdf.explore()

#leafmap.nasa_data_download(results[:5], out_dir="data")
数据特征
空间覆盖范围:北纬 30 度至 90 度之间的环极地区
空间分辨率0.1 至 0.5 度
时间覆盖范围:2016-07-24 至 2019-12-31
时间分辨率:每小时
研究区域:所有经纬度均以十进制度表示。
Site | Westernmost Longitude | Easternmost Longitude | Northernmost Latitude | Southernmost Latitude |
|---|---|---|---|---|
Circumpolar, Northern Hemisphere | -180 | 180 | 90 | 30 |
数据信息
有 304,578 个 netCDF(*.nc)格式的数据文件,分 32 个 TAR/GZIP 归档文件,这些文件提供了 WRF-STILT 模拟一个受体位置的足迹场,该受体位置由唯一的经纬度、高度和时间坐标定义。每个足迹场都是每个受体释放的 500 个粒子的累积正表面通量贡献的网格表示,这些粒子在 10 天内的时间回溯(见配套数据集,Henderson 等人,2021 年)。足迹在经纬度和时间网格上显示,从 STILT 模拟开始时间起每小时回溯一次,文件名中提供了该时间。
文件名为 footYYYxMMxDDxhhxmmxLATxLONxHEIGHT.nc,其中
YYYY = 文件年份、 MM = 文件的月份、 DD = 文件的日、 hh = 文件的小时(UTC 时)、 mm = 文件的分钟(UTC)、 LAT = 以十进制度表示的文件纬度、 LON = 以十进制度表示的文件经度,以及 HEIGHT = 文件离地面的高度,以米为单位。
例如,foot2013x06x25x04x00x65.1330Nx147.4539Wx00003.nc 文件包含 2013 年 6 月 25 日 4:00 UTC 时的模拟足迹。观测点位于受体位置 65.1330N,127.4539W,距地面 3 米处。
足迹文件按平台类型归入档案(尽管有些平台是合并的),并根据环极足迹场的分辨率分为 "低分辨率 "或 "高分辨率"(表 1)。对于低分辨率文件,北纬 30 度以上的环极足迹区域(变量名以 foot1 开头)是在 0.5 度网格上生成的。对于高分辨率文件,足迹区域在 0.5 度和 0.1 度网格上生成(变量名分别以 foot1 和 foot2 开始)。除以 footnearfield1 开头的变量(仅出现在低分辨率文件中)外,所有足迹场都以每小时的时间分辨率覆盖环极地区(30N 至 90N,180E 至 180W)。
低分辨率文件包含环极 0.5 度网格上的足迹字段(变量名以 foot1 开始)和每个受体位置当地的 0.1 度网格(3 度 x 5 度范围)(变量名以 footnearfield1 开始)。这些文件的内容与 NASA CARVE 活动生成的文件相同(Miller 和 Dinardo,2012 年)。
高分辨率文件除了传统的 0.5 度网格(变量名以 foot2 开头)外,还包含一个新的环极 0.1 度网格(变量名以 foot1 开头)。对于高分辨率文件中的每个分辨率,还对场进行了重新采样,以增加颗粒稀疏区域的空间连续性。
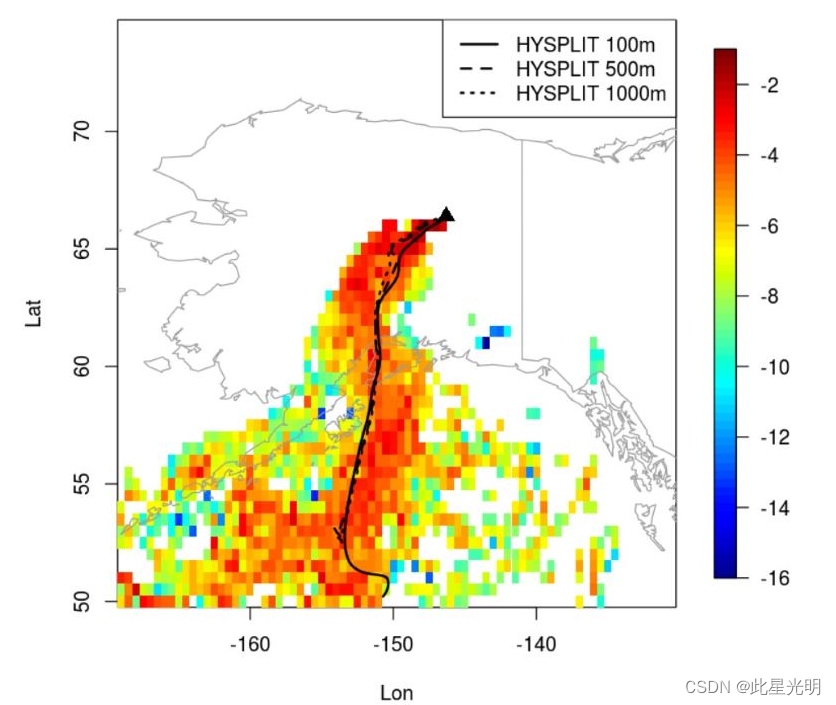
此外,还包括两个媒体(*.mp4)格式的配套文件,说明 500 个粒子在 10 天内汇聚到受体(观测)位置时的移动情况:69.6246N,162.3022E。动画展示了从两个时间点开始的模拟粒子轨迹:2015-04-24 0400 UTC 和 2015-10-15 0200 UTC。受 WRF 模型驱动的气象条件以及随机因素的影响,粒子轨迹是通过模拟从受体的时间和位置向后移动来估算的。当模拟粒子在全球移动时,其路径会在地球表面留下一个 "足迹"(即一个二维场),该 "足迹 "与位于行星边界下半部的粒子数量成正比;因此,假定该 "足迹 "会累积来自地球表面的通量。由此产生的足迹场显示了 10 天模拟期间粒子对受体位置的累积贡献。WRF-STILT 的足迹显示了影响受体测量到的温室气体浓度的上风区域。更多信息,请参阅 Henderson 等人(2015 年)。
表 1.包含数据文件的 32 个 TAR/GZIP 存档的名称和说明。OCO 受体一栏表示受体数据是否从轨道碳观测站-2(OCO-2 Lite,v9)收集。对于非 OCO 平台,"PFP "指的是飞机上的可编程烧瓶包(Programmable Flask Packages),从列出的站点出发,其余平台是收集温室气体原位样本的固定站点。
File Name | Number of netCDF Files | Spatial Resolution | OCO Receptor | Platform & Date |
|---|---|---|---|---|
ACG_2017_insitu-footprints.tar.gz | 14,320 | low | no | Alaska Coast Guard, in situ measurements, 2017 |
ACG_2017_PFP-footprints.tar.gz | 99 | low | no | Alaska Coast Guard, PFP measurements, 2017 |
ArcticCAP_2017_insitu-footprints.tar.gz | 45,450 | low | no | Arctic Carbon Aircraft Profiles, in situ measurements, 2017 |
ArcticCAP_2017_PFP-footprints.tar.gz | 331 | low | no | Arctic Carbon Aircraft Profiles, PFP measurements, 2017 |
ASCENDS_2017_insitu-footprints.tar.gz | 12,845 | high | no | Ascends/ABoVE 2017 Airborne Campaign, PFP measurements, 2017 |
ATom2_2017_insitu-footprints.tar.gz | 5667 | high | no | Atmospheric Tomography Mission (ATom), in situ measurements, January-February 2017 |
ATom2_2017-2019-PFP-footprints.tar.gz | 59 | high | no | Atmospheric Tomography Mission (ATom), PFP measurements, January- February 2017 |
ATom3_2017_insitu-footprints.tar.gz | 5598 | low | no | Atmospheric Tomography Mission (ATom), in situ measurements, September-October 2017 |
ATom3_2018_PFP-footprints.tar.gz | 31 | low | no | Atmospheric Tomography Mission (ATom), PFP measurements, September-October 2018 |
ATom4_2017-2019_PFP-footprints.tar.gz | 43 | high | no | Atmospheric Tomography Mission (ATom), PFP measurements, 2017-2019 |
ATom4_2018_insitu-footprints.tar.gz | 6011 | high | no | Atmospheric Tomography Mission (ATom), in situ measurements, April-May 2018 |
BRW_2017-2019_PFP-footprints.tar.gz | 349 | high | no | Barrow Atmospheric Baseline Observatory, PFP measurements, 2017-2019 |
CBA_2017-2019_PFP-footprints.tar.gz | 306 | high | no | Cold Bay Alaska, PFP measurements, 2017-2019 |
EC-BRW-CRV_insitu-footprints.tar.gz | 9844 | high | no | Environment Canada + Barrow Atmospheric Baseline Observatory + Carbon in Arctic Reservoirs Vulnerability Experiment, 2019 |
ECCC_2019-footprints.tar.gz | 2000 | high | no | Environment and Climate Change Canada, 2017-2019 |
ESP_2017-2019_PFP-footprints.tar.gz | 765 | high | no | Estevan Point British Columbia, PFP measurements, 2017-2019 |
ETL_2017-2019_PFP-footprints.tar.gz | 420 | high | no | East Trout Lake Saskatchewan, PFP measurements, 2017-2019 |
LEF_2017-2019_PFP-footprints.tar.gz | 717 | high | no | Park Falls Wisconsin, PFP measurements, 2017-2019 |
NSA-7800_2016-footprints.tar.gz | 7800 | low | no | Modeled using v391 terrain heights, North Slope of Alaska-7800, 2016 |
NSA-7802_2016-footprints.tar.gz | 7802 | low | no | Modeled using v351 terrain heights, North Slope of Alaska-7802, 2016 |
OCO2-201700-d01-footprints.tar.gz | 22,061 | high | yes | WRF model domain d01, January-April and August-December 2017 |
OCO2-201700-d02-footprints.tar.gz | 23,075 | high | yes | WRF model domain d02, January-May and August-December 2017 |
OCO2-201700-d03-footprints.tar.gz | 10,153 | high | yes | WRF model domain d03, January-May and August-December 2017 |
OCO2-201705-d01-footprints.tar.gz | 22,230 | high | yes | WRF model domain d01, May 2017 |
OCO2-201706-d01-footprints.tar.gz | 25,675 | high | yes | WRF model domain d01, June 2017 |
OCO2-201706-d02-footprints.tar.gz | 35,217 | high | yes | WRF model domain d02, June 2017 |
OCO2-201706-d03-footprints.tar.gz | 12,675 | high | yes | WRF model domain d03, June 2017 |
OCO2-201707-d01-footprints.tar.gz | 29,926 | high | yes | WRF model domain d01, July 2017 |
OCO2-201707-d02-footprints.tar.gz | 35,061 | high | yes | WRF model domain d02, July 2017 |
OCO2-201707-d03-footprints.tar.gz | 12,428 | high | yes | WRF model domain d03, July 2017 |
OCO2-2018-particles.tar.gz | 572 | high | yes | OCO-2, 2018 |
PFA_2017-2019_PFP-footprints.tar.gz | 498 | high | no | Poker Flat Alaska, PFP measurements, 2017-2019 |
数据信息
Variable | Units | Description |
|---|---|---|
All Footprint Files | ||
ident | char | Identifier string |
nchar | 1 | Numeric identifier |
origagl | meters | Original receptor height above ground before rounding for STILT |
origlat | degrees_north | Original receptor latitude |
origlon | degrees_east | Original receptor longitude |
origutctime | UTC time | Original receptor time |
origutctimeformat | char | Format string for original receptor time |
foot1 | ppm per (μmol m-2 s-1) | Gridded STILT footprint in time, latitude, longitude. Resolution is 0.5 degree for low-resolution files and 0.1 degree for high-resolution files |
foot1date | days since 2000-01-01 00:00:00 UTC | Date of foot1 |
foot1hr | hours | Hours back from STILT start time encoded in file name |
foot1lat | degrees_north | Degrees latitude of center of grid cells |
foot1lon | degrees_east | Degrees longitude of center of grid cells |
footnearfield1 | ppm per (μmol m-2 s-1) | Gridded STILT footprint at 0.1 degree resolution near receptor location. |
footnearfield1date | days since 2000-01-01 00:00:00 UTC | Date for 'footnearfield1' |
footnearfield1hr | hours | Hours back from STILT start time for 'footnearfield1' |
footnearfield1lat | degrees_north | Degrees latitude of center of grid cells |
footnearfield1lon | degrees_east | Degrees longitude of center of grid cells |
High-Resolution Files Only | ||
foot1_resampled | ppm per (μmol m-2 s-1) | Aggregates particle footprints on a x,y,time grid starting at STILT start time |
foot1_resampledlon | degrees_east | Degrees longitude of center of grid cells |
foot1_resampledlat | degrees_north | Degrees latitude of center of grid cells |
foot1_resampleddate | days since 2000-01-01 00:00:00 UTC | Date for resampled time steps |
foot1_resampledhr | hours | Hours back from STILT start time |
foot1_resampledfactors | 1 | Factors used to calculate resampled footprint. See variable attributes for (a) the resampling (mean/med/max) method, (b) the spread (sqrtN/sqrtT) method, and (c) how the resampling and spread methods were combined (maximum of two, average, resample only, spread only). |
foot1_resampledfactorsnames | char | Names of the resampling factors: "resampling", "spread", "combined" |
foot1_resampledfactorsdate | days since 2000-01-01 00:00:00 UTC | Date for resampled time steps |
foot2 | ppm per (μmol m-2 s-1) | Aggregates particle footprints on a x,y,time grid starting at STILT start time. Resolution is 0.5 degree. |
foot2lon | degrees_east | Degrees longitude of center of grid cells |
foot2lat | degrees_north | Degrees latitude of center of grid cells |
foot2date | days since 2000-01-01 00:00:00 UTC | Date for resampled time steps |
foot2hr | hours | Hours back from STILT start time |
foot2_resampled | ppm per (μmol m-2 s-1) | Aggregates particle footprints on a x,y,time grid starting at STILT start time |
foot2_resampledlon | degrees_east | Degrees longitude of center of grid cells |
foot2_resampledlat | degrees_north | Degrees latitude of center of grid cells |
foot2_resampleddate | days since 2000-01-01 00:00:00 UTC | Date for resampled time steps |
foot2_resampledhr | hours | Hours back from STILT start time |
foot2_resampledfactors | 1 | Factors used to calculate resampled footprint. See variable attributes for (a) the resampling (mean/med/max) method, (b) the spread (sqrtN/sqrtT) method, and (c) how the resampling and spread methods were combined (maximum of two, average, resample only, spread only). |
foot2_resampledfactorsnames | char | Names of the resampling factors: "resampling", "spread", "combined" |
foot2_resampledfactorsdate | days since 2000-01-01 00:00:00 UTC | Date for resampled time steps |
应用与推导
WRF-STILT 粒子文件和足迹与化学物种无关,但它们支持利用机载和塔式观测对 CO2 和 CH4 地表-大气通量进行精确估算。极地植被光合作用和呼吸作用模型(PolarVPRM;Luus 和 Lin,2015 年)根据 WRF-STILT 的足迹模拟出的二氧化碳摩尔分数与塔观测数据非常吻合,表明 WRF-STILT 模型很好地代表了该地区的气象(Karion 等人,2016 年)。
建议用户同时评估原始 foot1 和重采样 foot1 场,尽管重采样场是最好的产品。对于高分辨率文件,为了与之前的 CARVE 和 ABoVE 时代的文件保持一致,应使用传统的 0.5 度原始 foot2 场。
数据获取、材料和方法
该项目试图利用 WRF-STILT 耦合模型来模拟陆面排放的温室气体在大气中的移动。在随机时间倒拉格朗日传输(STILT)模型(Lin 等人,2003 年)中,来自飞机样本和通量塔位置的位置数据被视为受体。大气运动由气象和研究预测(WRF)模型(Skamarock 和 Klemp,2008 年)中的气象场驱动。WRF 模式的配置是为了在北极、阿拉斯加北部和加拿大西北部生成高质量、高分辨率的气象场。为本项目运行的 WRF 模式紧跟 Nehrkorn 等人(2018 年)的模式配置。Henderson 等人(2015 年)对 WRF-STILT 建模框架进行了更广泛的描述。对于本文所述的低分辨率和高分辨率场,除 NSA-7802_2016-footprints.tar.gz 文件使用 WRF v3.5.1 地形高度外,所有文件均使用 WRF v3.9.1 及其改进的地形表示法。
STILT 是一种拉格朗日粒子扩散模型,从测量位置("受体 "位置)开始逆时针应用,以 "足迹 "场的形式创建传输模型的临界点(Nehrkorn 等人,2010 年;Henderson 等人,2015 年)。足迹的单位是混合比(ppm CO2;ppb CH4)/(μmol m-2 s-1),它量化了上风地表通量对受体测量浓度的影响,计算方法是计算受地表影响体积内的粒子数量和在该体积内停留的时间(如图 1)。由此产生的足迹是一个网格产品,它说明了在模拟的时间步骤中,对特定地点、高度和时间测量到的粒子浓度有影响的区域。
在配套数据集(Henderson 等人,2021 年)中,与低分辨率足迹文件(即以英尺开头的 netCDF 文件)相对应的粒子轨迹文件(即以高跷开头的 netCDF 文件)包含足迹字段的副本。与高分辨率足迹文件相对应的粒子文件中不包含足迹字段。
为了填补稀疏区域的数据,对环极高分辨率 STILT 脚印采用了重新取样/平滑/展宽算法。这种算法需要对取样不足进行补偿,因为取样不足会导致足迹区域不完整、不均匀。这一平滑步骤适用于原始网格化足迹区域(即在精细足迹网格上对原始颗粒足迹进行网格化计算)。每个后向轨迹时间步长的平滑长度尺度是根据粒子的扩散情况确定的。然后,将该平滑长度与对应于该时间步的足迹时间步之间的粒子位移中位数的单独长度尺度进行比较。默认情况下,重采样使用两个长度的最大值(方法 ="max")。不过,设置重采样比例的其他选项包括:两个长度比例的平均值("avg")、仅使用扩散距离("spread")或仅使用位移距离("resample "或 "med")。脚*_重采样因子变量的属性中记录了所采用的重采样方法。这些变量提供了每个时间步的重采样因子。Fasoli 等人(2018 年)也描述了类似的方法,他们采用的是对每个粒子的足迹应用核密度估算器进行扩展。