用V5版本Seurat做单细胞数据文献复现

上周群里的小伙伴想让我复现一篇单细胞文献数据,看了一下是比较基础的分析流程。想到自己之前也没完整展示用V5版本的Seurat的分析流程,所以就以此当示例数据来分享以下这篇复现流程。
V5和V4的代码区别主要在前期导入数据和其中的数据有些许改变,曾老师在之前的几篇推文还有直播中都有提到。
例如:
v4: sce.all@assays$RNA@counts;
v5: sce.all@assaysRNAcounts / sce.all@assaysRNA@layerscounts。
当然harmony的整合方式也有改变,如下代码所示,从官网上copy过来的代码。但是本周推文并没有修改此处的代码。
# load in the pbmc systematic comparative analysis dataset
obj <- LoadData("pbmcsca")
obj <- subset(obj, nFeature_RNA > 1000)
obj <- RunAzimuth(obj, reference = "pbmcref")
# currently, the object has two layers in the RNA assay: counts, and data
obj
obj[["RNA"]] <- split(obj[["RNA"]], f = obj$Method)
obj
obj <- NormalizeData(obj)
obj <- FindVariableFeatures(obj)
obj <- ScaleData(obj)
obj <- RunPCA(obj)
obj <- RunUMAP(obj, dims = 1:30, reduction = "pca", reduction.name = "umap.unintegrated")
# visualize by batch and cell type annotation
# cell type annotations were previously added by Azimuth
DimPlot(obj, reduction = "umap.unintegrated", group.by = c("Method", "predic.celltype.l2"))
下面先让我简要介绍一下这篇文献。
紫外线照射皮肤的单细胞 RNA 序列分析揭示了与光照相关的炎症和维生素 D 的保护作用 。

本研究通过单细胞测序对紫外线照射后的小鼠皮肤进行了研究。观察到紫外线照射后的小鼠皮肤主要诱发成纤维细胞炎症,并显示出不同的基因表达。
要复现的图:
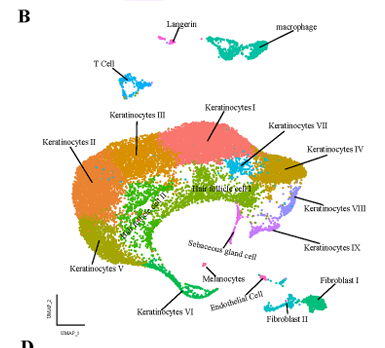
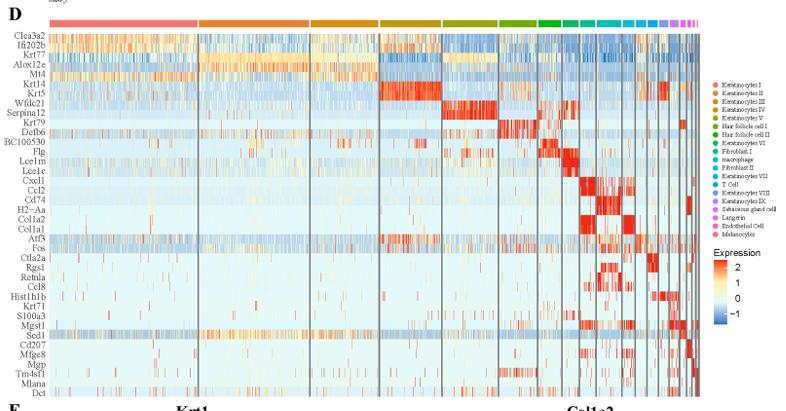
image.png
step1~ step4:导入数据 - 降维聚类分群
###如何使用安装好的v5###
#使用的时候加载v5路径
.libPaths(c(
  '/home/data/t140333/seurat_v5/',
  "/home/data/t140333/R/x86_64-pc-linux-gnu-library/4.3",
  "/usr/local/lib/R/library"
))
getwd()
#再次检测所用的Seurat版本
packageVersion("Seurat")

#setwd("../")
rm(list=ls())
options(stringsAsFactors = F)
source('scRNA_scripts/lib.R')

###### step1:导入数据 ######
# https://www.ncbi.nlm.nih.gov/geo/query/acc.cgi?acc=GSE173385
dir='GSE173385_raw/'
samples=list.files( dir ,pattern = 'gz')
samples
library(data.table)
ctList = lapply(samples,function(pro){
  # pro=samples[1]
  print(pro)
  ct=fread(file.path( dir ,pro),data.table = F)
  ct[1:4,1:4]
  rownames(ct)=ct[,1]
  colnames(ct) = paste(gsub('_matrix.tsv.gz','',pro),
                       colnames(ct) ,sep = '_')
  ct=ct[,-1]
  return(ct)
})

#检查行列数目,目的是找交集基因-----
lapply(ctList, dim)
tmp =table(unlist(lapply(ctList, rownames)))
head(tmp)
cg = names(tmp)[tmp==length(samples)]
head(cg)

#合并矩阵-----
bigct = do.call(cbind,
                lapply(ctList,function(ct){
                  ct = ct[cg,]
                  return(ct)
                }))
dim(bigct)

#报错需更新Matrix版本
# Error in validObject(.Object) :
#   invalid class “LogMap” object: superclass "mMatrix" not defined in the environment of the object's class

#library(Matrix)
sce.all=CreateSeuratObject(counts = bigct,
                           min.cells = 5,
                           min.features = 300)
sce.all
as.data.frame(sce.all@assays$RNA$counts[1:10, 1:2])
head(sce.all@meta.data, 10)
table(sce.all@meta.data$orig.ident)
zz<-as.data.frame(sce.all@assays$RNA$counts[1:1000, 1:2])
getwd()
###### step2:QC质控 ######
dir.create("./1-QC")
setwd("./1-QC")
# 如果过滤的太狠,就需要去修改这个过滤代码
source('../scRNA_scripts/qc.R')
sce.all.filt = basic_qc(sce.all)
print(dim(sce.all))
print(dim(sce.all.filt))
setwd('../')

#如果你的数据集是human要修改sp="human"
sp='mouse'
# install.packages("Matrix", type = "source")
# install.packages("irlba", type = "source")
###### step3: harmony整合多个单细胞样品 ######
dir.create("2-harmony")
getwd()
setwd("2-harmony")
source('../scRNA_scripts/harmony.R')
# 默认 ScaleData 没有添加"nCount_RNA", "nFeature_RNA"
# 默认的
sce.all.int = run_harmony(sce.all.filt)
setwd('../')

###### step4: 降维聚类分群和看标记基因库 ######
# 原则上分辨率是需要自己肉眼判断,取决于个人经验
# 为了省力,我们直接看  0.1和0.8即可
table(Idents(sce.all.int))
table(sce.all.int$seurat_clusters)
table(sce.all.int$RNA_snn_res.0.1)
table(sce.all.int$RNA_snn_res.0.8)

getwd()
dir.create('check-by-0.1')
setwd('check-by-0.1')
sel.clust = "RNA_snn_res.0.1"
sce.all.int <- SetIdent(sce.all.int, value = sel.clust)
table(sce.all.int@active.ident)
source('../scRNA_scripts/check-all-markers.R')
setwd('../')
getwd()

dir.create('check-by-0.8')
setwd('check-by-0.8')
sel.clust = "RNA_snn_res.0.8"
sce.all.int <- SetIdent(sce.all.int, value = sel.clust)
table(sce.all.int@active.ident)
source('../scRNA_scripts/check-all-markers.R')
setwd('../')
getwd()

last_markers_to_check
step5: 确定单细胞亚群生物学名字
###### step5: 确定单细胞亚群生物学名字 ######
# 一般来说,为了节省工作量,我们选择0.1的分辨率进行命名
# 因为命名这个步骤是纯人工 操作
# 除非0.1确实分群太粗狂了,我们就选择0.8
source('scRNA_scripts/lib.R')
#sce.all.int = readRDS('2-harmony/sce.all_int.rds')
colnames(sce.all.int@meta.data)
table(sce.all.int$RNA_snn_res.0.8)
pdf('orig.ident-vs-RNA_snn_res.0.1.pdf')
gplots::balloonplot(table(sce.all.int$RNA_snn_res.0.1,sce.all.int$orig.ident))
dev.off()
#文章给出的marker gene
# keratinocytes (Krt5, Krt14),
# hair follicle cells (Krt17, Krt79, Sox9, HFCs),
# fibroblasts (Col1a1, Dcn, Lum),
# myeloid (Cd74, Lyz2),
# sebaceous gland cells (Mgst1, Krt25, Pparg),
# T cells (Cd3d, Nkg7),
# endothelial cells (Mgp, Fabp4, ECs),
# melanocytes (Mlana, Pmel)
#文章中把Keratinocytes细分成多个亚群,我这里就统称为一个了,所以细胞亚群命名会存在与原文有一定的差异~
# 5,6,0,2,3,4,1,8,7,18,12,14,20 Keratinocytes
# 15,13:Fibroblast
# 22:Endo
# 11,17:macrophage
# 16:T
# 23:melanocytes
# 9,10:Hair follicle cell
# 19:sebaceous
pdf('orig.ident-vs-RNA_snn_res.0.1.pdf')
gplots::balloonplot(table(sce.all.int$RNA_snn_res.0.1,sce.all.int$orig.ident))
dev.off()
setwd("../")
getwd()
if(T){
  sce.all.int
  celltype=data.frame(ClusterID=0:23 ,
                      celltype= 0:23 )
  #定义细胞亚群
  celltype[celltype$ClusterID %in% c( 5,6,0,2,3,4,1,8,7,18,12,14,20,21 ),2]='Keratinocytes'
  celltype[celltype$ClusterID %in% c( 15,13 ),2]='Fibroblast'
  celltype[celltype$ClusterID %in% c( 22 ),2]='Endo'
  celltype[celltype$ClusterID %in% c( 11,17 ),2]='macrophage'
  celltype[celltype$ClusterID %in% c( 16),2]='T'
  celltype[celltype$ClusterID %in% c( 23 ),2]='melanocytes'
  celltype[celltype$ClusterID %in% c( 9,10 ),2]='Hair follicle cell'
  celltype[celltype$ClusterID %in% c( 19 ),2]='sebaceous'
  head(celltype)
  celltype
  table(celltype$celltype)
  sce.all.int@meta.data$celltype = "NA"

  for(i in 1:nrow(celltype)){
    sce.all.int@meta.data[which(sce.all.int@meta.data$RNA_snn_res.0.8 == celltype$ClusterID[i]),'celltype'] <- celltype$celltype[i]}
  Idents(sce.all.int)=sce.all.int$celltype

  table( Idents(sce.all.int))


  sel.clust = "celltype"
  sce.all.int <- SetIdent(sce.all.int, value = sel.clust)
  table(sce.all.int@active.ident)

  dir.create('check-by-celltype')
  setwd('check-by-celltype')
  source('../scRNA_scripts/check-all-markers.R')
  setwd('../')
  getwd()
}
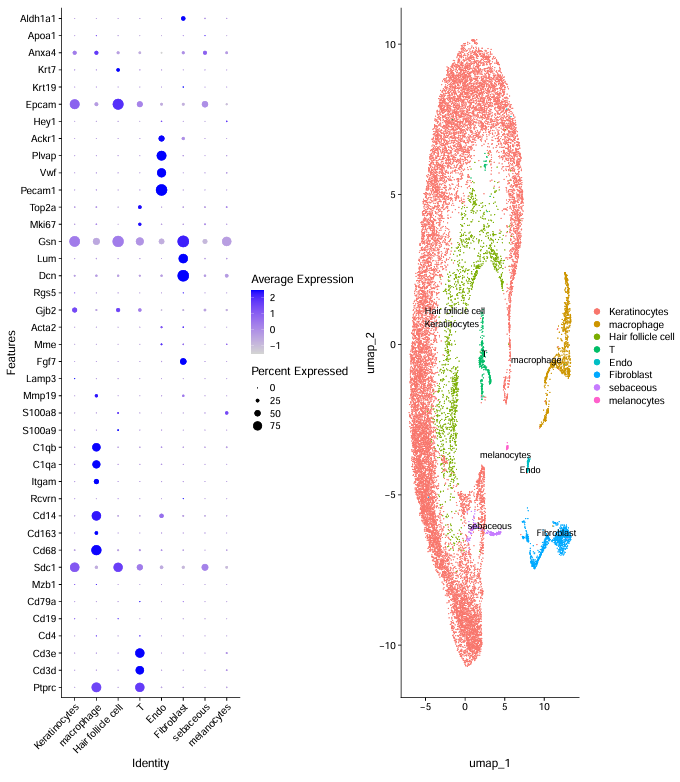
image.png
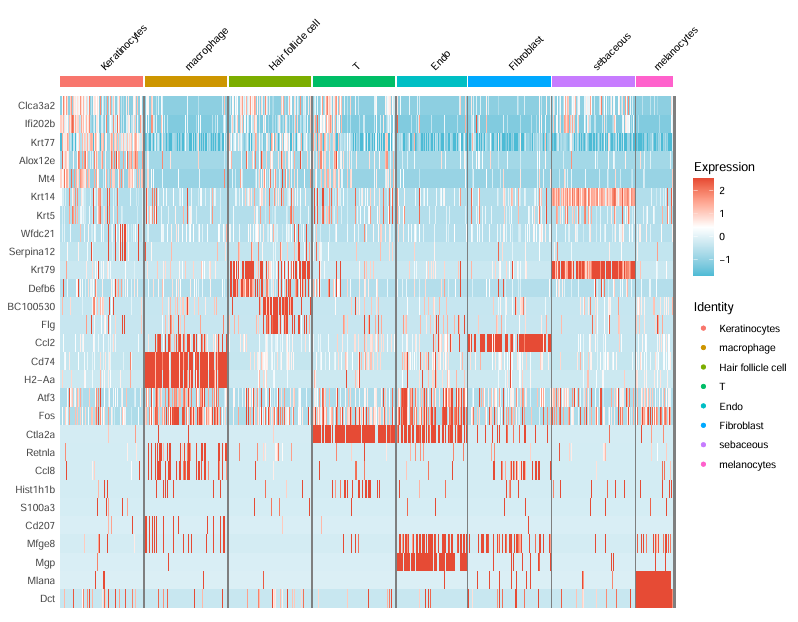
step6:热图可视化
getwd()
#step6:热图可视化
GSE173385_selected_genes

DoHeatmap(subset(sce.all.int,downsample=100),GSE173385_selected_genes,size=3)+
  scale_fill_gradientn(colors = c("#4DBBD5","white","#E64B35"))
ggsave(filename=paste0(pro,'DoHeatmap_check_GSE173385_markers_by_clusters.pdf') ,
       width=10,height=8)

library(stringr)
#图片转换https://ocr.wdku.net/index_pictranslation
gene<-c("Clca3a2 Ifi202b Krt77 Alox12e Mt4 Krt14 Krt5 Wfdc21 Serpina12 Krt79 Defb6 BC100530 Flg Lcelm Lcelc Cxcll Ccl2 Cd74 H2-Aa Colla2 Collal Atf3 Fos Ctla2a Rgsl Retnla Ccl8 Hist1h1b Krt71 S100a3 Mgstl Scdl Cd207 Mfge8 Mgp Tm4sfl Mlana Dct")
gene2<-as.data.frame(strsplit(gene," ",","))
colnames(gene2)<-"gene"
p1 <- DotPlot(sce.all.int, features = gene2$gene )  + coord_flip()+theme(axis.text.x=element_text(angle=45,hjust = 1))
p1
DoHeatmap(subset(sce.all.int,downsample=100),gene2$gene,size=3)+
  scale_fill_gradientn(colors = c("#4DBBD5","white","#E64B35"))
ggsave(filename='gene_DoHeatmap_check_GSE173385_markers_by_clusters.pdf' ,
       width=10,height=8)
因为篇幅有限,在此只展示check-all-markers.R 的部分代码,不过跑出来这篇文献的结果下面这些marker gene差不多够用了,因为还补充了文献给出的marker gene。
GSE173385_selected_genes=  c("Krt5", "Krt14",
                   "Krt17", "Krt79",
                   "Sox9", "HFCs",
                   "Col1a1","Dcn",
                   "Lum","Cd74","Lyz2",
                   "Mgst1","Krt25","Pparg",
                   "Cd3d","Nkg7","Mgp","Fabp4",
                   "ECs","Mlana",
                   "Pmel")

gastric_cancer_markers = c('PTPRC',
                   'MUC2' , 'ITLN1',
                   'FABP1' , 'APOA1',
                   'CEACAM5' , 'CEACAM6',
                   'EPCAM', 'KRT18', 'MUC1',
                   'MUC6' , 'TFF2',
                   'PGA4' , 'PGA3',
                   'MUC5AC' , 'TFF1','CHGA' , 'CHGB')
Myo=c("Krt17", "Krt14", "Krt5", "Acta2", "Myl9", "Mylk", "Myh11")
Lum=c("Krt19", "Krt18", "Krt8")
Hs=c("Prlr", "Cited1", "Pgr", "Prom1", "Esr1")
AV=c("Mfge8", "Trf", "Csn3", "Wfdc18", "Elf5", "Ltf")
Lp=c("Kit", "Aldh1a3", "Cd14")
Fib=c("Col1a1", "Col1a2", "Col3a1", "Fn1")
GSE150580_breast_cancer_markers_list =list(
  Myo=Myo,
  Lum=Lum,
  Hs=Hs,
  AV=AV,
  Lp=Lp,
  Fib=Fib

)

last_markers = c('PTPRC', 'CD3D', 'CD3E', 'CD4','CD8A',
                   'CD19', 'CD79A', 'MS4A1' ,
                   'IGHG1', 'MZB1', 'SDC1',
                   'CD68', 'CD163', 'CD14',
                   'TPSAB1' , 'TPSB2',  # mast cells,
                   'RCVRN','FPR1' , 'ITGAM' ,
                   'C1QA',  'C1QB',  # mac
                   'S100A9', 'S100A8', 'MMP19',# monocyte
                   'FCGR3A',
                   'LAMP3', 'IDO1','IDO2',## DC3
                   'CD1E','CD1C', # DC2
                   'KLRB1','NCR1', # NK
                   'FGF7','MME', 'ACTA2', ## human  fibo
                 'GJB2', 'RGS5',
                   'DCN', 'LUM',  'GSN' , ## mouse PDAC fibo
                   'MKI67' , 'TOP2A',
                   'PECAM1', 'VWF',  ## endo
                 "PLVAP",'PROX1','ACKR1','CA4','HEY1',
                   'EPCAM' , 'KRT19','KRT7', # epi
                   'FYXD2', 'TM4SF4', 'ANXA4',# cholangiocytes
                   'APOC3', 'FABP1',  'APOA1',  # hepatocytes
                   'Serpina1c',
                   'PROM1', 'ALDH1A1' )
GSE173385_selected_genes
gastric_cancer_markers
last_markers


markers = c("GSE173385_selected_genes",'gastric_cancer_markers'
            'last_markers' )
p_umap=DimPlot(sce.all.int, reduction = "umap",label = T,repel = T)
p_umap

if(sp=='human'){
   lapply(markers, function(x){
     #x=markers[1]
     genes_to_check=str_to_upper(get(x))
     DotPlot(sce.all.int , features = genes_to_check )  +
       coord_flip() +
       theme(axis.text.x=element_text(angle=45,hjust = 1))

     h=length( genes_to_check )/6+3;h
     ggsave(paste('check_for_',x,'.pdf'),height = h)
   })
  lapply(markers_list, function(x){
    # x=markers_list[1]
    genes_to_check = lapply(get(x), str_to_upper)
    dup=names(table(unlist(genes_to_check)))[table(unlist(genes_to_check))>1]
    genes_to_check = lapply(genes_to_check, function(x) x[!x %in% dup])

    DotPlot(sce.all.int , features = genes_to_check )  +
     # coord_flip() +
      theme(axis.text.x=element_text(angle=45,hjust = 1))

    w=length( unique(unlist(genes_to_check)) )/5+6;w
    ggsave(paste('check_for_',x,'.pdf'),width  = w)
  })

  last_markers_to_check <- str_to_upper(last_markers )

 }else if(sp=='mouse'){
   lapply(markers, function(x){
     #x=markers[1]
     genes_to_check=str_to_title(get(x))
     DotPlot(sce.all.int , features = genes_to_check )  +
       coord_flip() +
       theme(axis.text.x=element_text(angle=45,hjust = 1))

     h=length( genes_to_check )/6+3;h
     ggsave(paste('check_for_',x,'.pdf'),height = h)
   })
   lapply(markers_list, function(x){
     # x=markers_list[1]
     genes_to_check = lapply(get(x), str_to_title)
     dup=names(table(unlist(genes_to_check)))[table(unlist(genes_to_check))>1]
     genes_to_check = lapply(genes_to_check, function(x) x[!x %in% dup])

     DotPlot(sce.all.int , features = genes_to_check )  +
       # coord_flip() +
       theme(axis.text.x=element_text(angle=45,hjust = 1))

     w=length( unique(unlist(genes_to_check)) )/5+6;w
     ggsave(paste('check_for_',x,'.pdf'),width  = w)
   })

   last_markers_to_check <<- str_to_title(last_markers )
}else {
  print('we only accept human or mouse')
}

p_all_markers = DotPlot(sce.all.int , features = last_markers_to_check )  +
  coord_flip() +
  theme(axis.text.x=element_text(angle=45,hjust = 1))
p_all_markers+p_umap
h=length( last_markers_to_check )/6+3;h
w=length( unique( Idents(sce.all.int)) )/5+10;w
ggsave(paste('last_markers_and_umap.pdf'),width = w,height = h)本文参与?腾讯云自媒体分享计划,分享自微信公众号。
原始发表:2024-01-18,如有侵权请联系?cloudcommunity@tencent.com 删除
评论
登录后参与评论
推荐阅读